

Question: 4. Using the following dataset (Show your work): a. Pot the cata. How co you interpret the nature of the variation in the graph b.
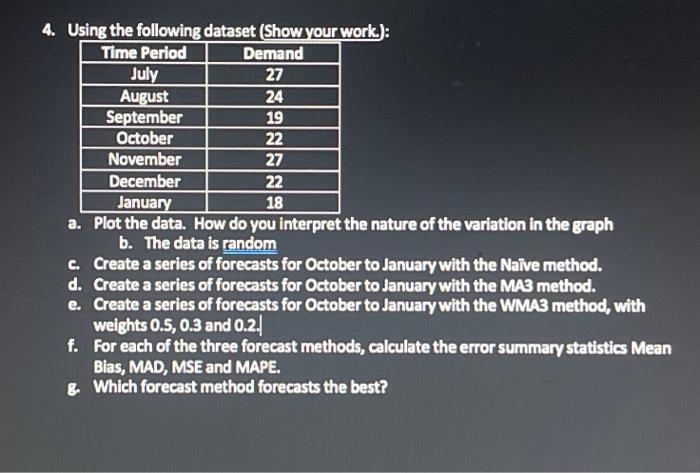
4. Using the following dataset (Show your work): a. Pot the cata. How co you interpret the nature of the variation in the graph b. The data is random c. Create a series of forecasts for October to January with the Naive method. d. Create a series of forecasts for October to January with the MA3 method. e. Create a series of forecasts for October to January with the WMAB method, with weights 0.5,0.3 and 0.2 . f. For each of the three forecast methods, calculate the error summary statistics Mean Blas, MAD, MSE and MAPE. g. Which forecast method forecasts the best
Step by Step Solution
There are 3 Steps involved in it
1 Expert Approved Answer
Step: 1 Unlock

Question Has Been Solved by an Expert!
Get step-by-step solutions from verified subject matter experts
Step: 2 Unlock
Step: 3 Unlock