

Question: 4 Which is an interval of decrease for the graph shown imp O 5 2 O 6 2 2 9 O 6 2 0 O
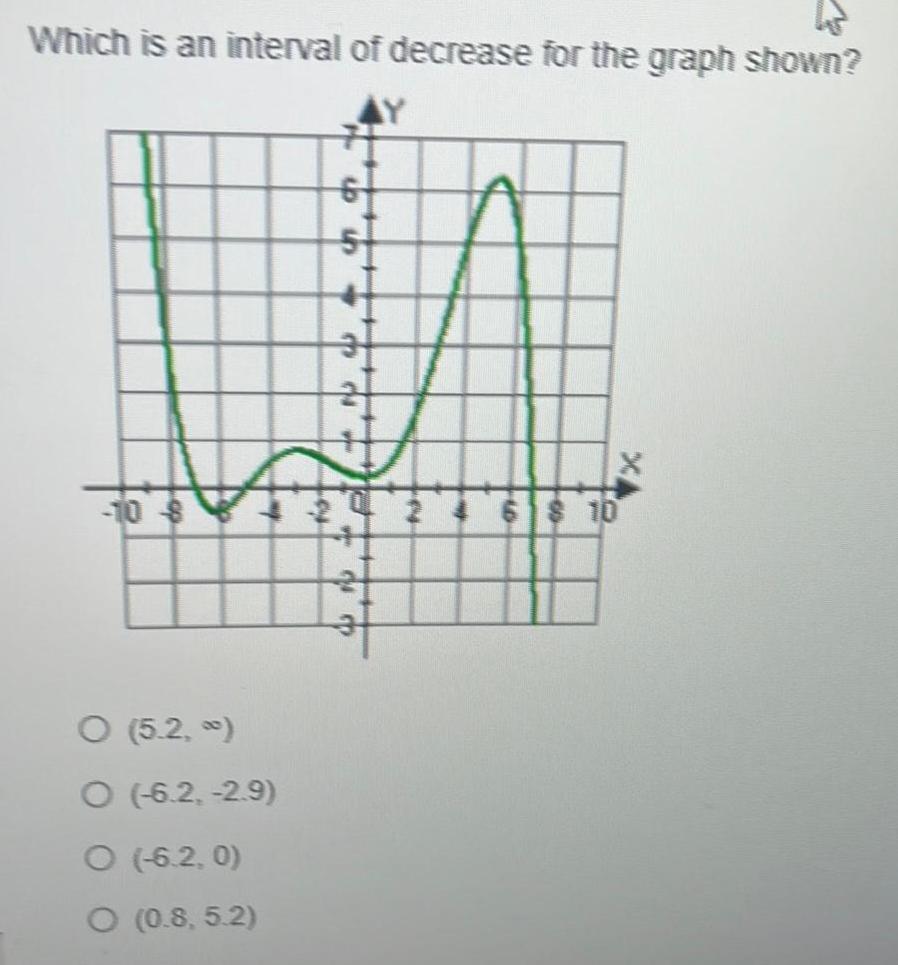

4 Which is an interval of decrease for the graph shown imp O 5 2 O 6 2 2 9 O 6 2 0 O 0 8 5 2 foy st 55 SI al 1 2 X 10
Step by Step Solution
There are 3 Steps involved in it
1 Expert Approved Answer
Step: 1 Unlock

Question Has Been Solved by an Expert!
Get step-by-step solutions from verified subject matter experts
Step: 2 Unlock
Step: 3 Unlock