

Question: 41. 42. The following table lists data collected during a recent experiment. In this case, x represents age (in years) and y represents the
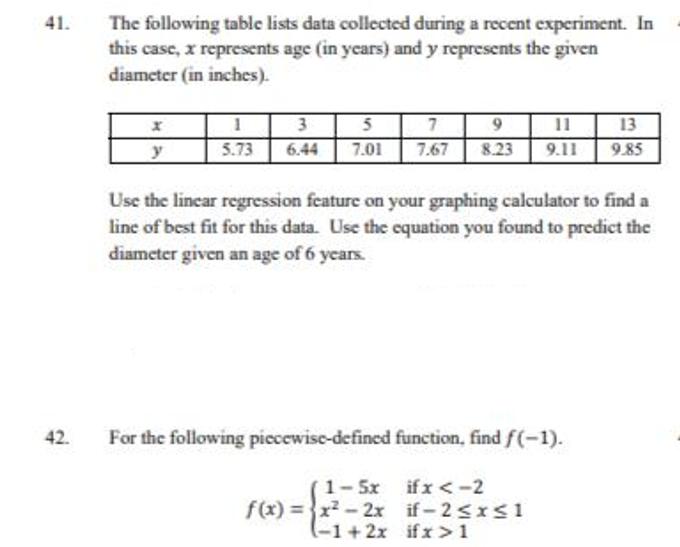
41. 42. The following table lists data collected during a recent experiment. In this case, x represents age (in years) and y represents the given diameter (in inches). 3 5 7 11 13 y 5.73 6.44 7.01 7.67 8.23 9.11 9.85 Use the linear regression feature on your graphing calculator to find a line of best fit for this data. Use the equation you found to predict the diameter given an age of 6 years. For the following piecewise-defined function, find f(-1). 1-5x ifx 1
Step by Step Solution
There are 3 Steps involved in it
41 Linear Regression for Diameter Prediction Steps on a Typical Graphing Calculator Input the Data G... View full answer

Get step-by-step solutions from verified subject matter experts