

Question: .. 4.10 Data collected on the yearly registrations for a Six Sigma seminar at the Quality College are shown in the following table: YEAR
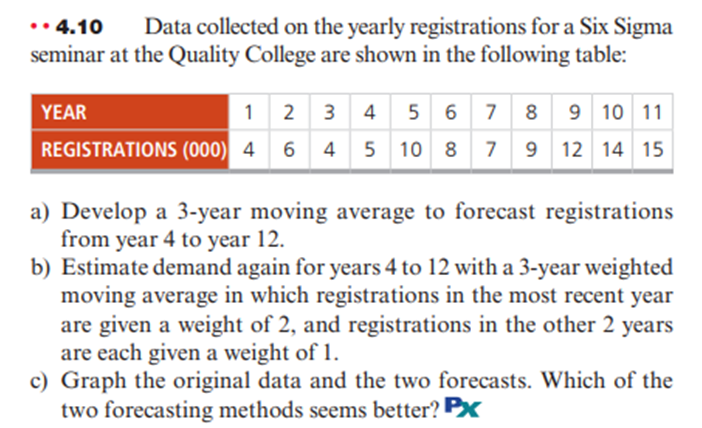
.. 4.10 Data collected on the yearly registrations for a Six Sigma seminar at the Quality College are shown in the following table: YEAR 1 2 3 4 56789 10 11 REGISTRATIONS (000) 464510879 12 14 15 a) Develop a 3-year moving average to forecast registrations from year 4 to year 12. b) Estimate demand again for years 4 to 12 with a 3-year weighted moving average in which registrations in the most recent year are given a weight of 2, and registrations in the other 2 years are each given a weight of 1. c) Graph the original data and the two forecasts. Which of the two forecasting methods seems better? PX
Step by Step Solution
There are 3 Steps involved in it

Get step-by-step solutions from verified subject matter experts