

Question: 47 1.5 Selected risk ratios are presented for 2011 and 2010 for Techtron Company. Also, refer to the financial statement data for the company. 2011
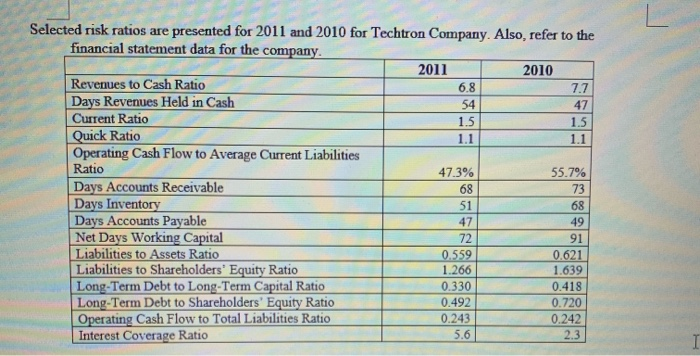
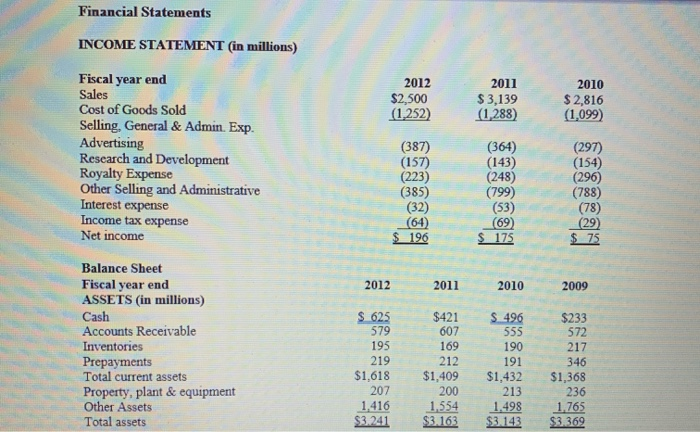

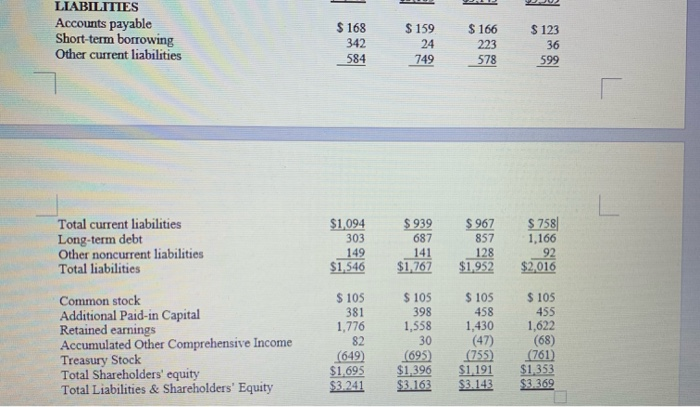
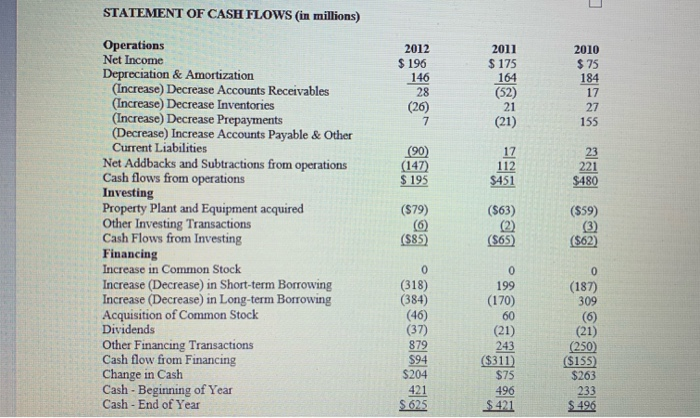
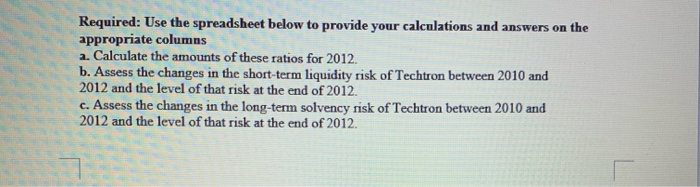
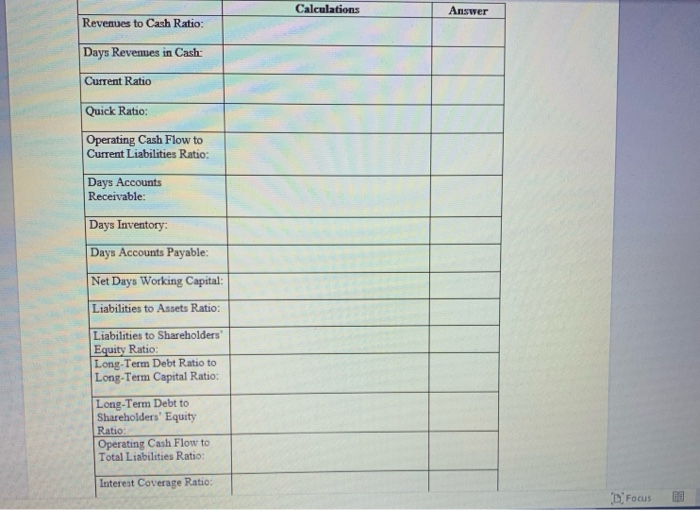
47 1.5 Selected risk ratios are presented for 2011 and 2010 for Techtron Company. Also, refer to the financial statement data for the company. 2011 2010 Revenues to Cash Ratio 6.8 7.7 Days Revenues Held in Cash Current Ratio Quick Ratio Operating Cash Flow to Average Current Liabilities Ratio 55.7% Days Accounts Receivable Days Inventory 51 Days Accounts Payable 47 Net Days Working Capital 72 Liabilities to Assets Ratio 0.559 Liabilities to Shareholders' Equity Ratio 1.266 Long-Term Debt to Long-Term Capital Ratio 0.330 Long-Term Debt to Shareholders' Equity Ratio 0.492 0.720 Operating Cash Flow to Total Liabilities Ratio 0.243 0.242 Interest Coverage Ratio 5.6 2.31 68 0.621 0.418 Financial Statements INCOME STATEMENT (in millions) 2012 $2,500 (1.252) 2011 $3,139 (1.288) 2010 $ 2,816 (1,099) Fiscal year end Sales Cost of Goods Sold Selling, General & Admin. Exp. Advertising Research and Development Royalty Expense Other Selling and Administrative Interest expense Income tax expense Net income (387) (157) (223) (385) (32) (364) (143) (248) (799) (297) (154) (296) (788) (53) 64) (69) $ 175 (29) $75 2012 2010 2009 Balance Sheet Fiscal year end ASSETS (in millions) Cash Accounts Receivable Inventories Prepayments Total current assets Property, plant & equipment Other Assets Total assets 607 169 579 195 219 $1.618 207 1,416 $3.241 $1,409 S 496 555 190 191 $1.432 213 1.498 $3.143 $233 572 217 346 $1,368 236 1.765 $3.369 S $3.163 22 LIABILITIES Accounts payable Short-term borrowing Other current liabilities $ 159 $123 $ 168 342 584 36 149 578 599 $1,094 $ 939 $ 967 $758 303 687 1,166 Total current liabilities Long-term debt Other noncurrent liabilities Total liabilities 149 $1,546 141 $1,767 128 $1,952 $2,016 $ 105 398 1,558 Common stock Additional Paid-in Capital Retained earnings Accumulated Other Comprehensive Income Treasury Stock Total Shareholders' equity Total Liabilities & Shareholders' Equity $ 105 381 1,776 82 (649) $1,695 $3.241 $ 105 458 1,430 (47) (755) $1.191 $3.143 $ 105 455 1,622 (68) (761) $1,353 $3.369 (695) $1,396 $3.163 STATEMENT OF CASH FLOWS (in millions) 2012 $ 196 2011 $ 175 164 2010 $ 75 184 146 28 (52) (26) (90) (147) $480 (579) ($59) Operations Net Income Depreciation & Amortization (Increase) Decrease Accounts Receivables (Increase) Decrease Inventories (Increase) Decrease Prepayments (Decrease) Increase Accounts Payable & Other Current Liabilities Net Addbacks and Subtractions from operations Cash flows from operations Investing Property Plant and Equipment acquired Other Investing Transactions Cash Flows from Investing Financing Increase in Common Stock Increase (Decrease) in Short-term Borrowing Increase (Decrease) in Long-term Borrowing Acquisition of Common Stock Dividends Other Financing Transactions Cash flow from Financing Change in Cash Cash - Beginning of Year Cash - End of Year 6 ($85) ($62) (318) (384) 199 (170) (187) 309 (6) (21) 879 (21) (250) ($311) $75 496 $ 421 233 $ 625 $ 496 Required: Use the spreadsheet below to provide your calculations and answers on the appropriate columns a. Calculate the amounts of these ratios for 2012 b. Assess the changes in the short-term liquidity risk of Techtron between 2010 and 2012 and the level of that risk at the end of 2012. c. Assess the changes in the long-term solvency risk of Techtron between 2010 and 2012 and the level of that risk at the end of 2012. Calculations Answer Answer Revenues to Cash Ratio: Days Revenues in Cash: Current Ratio Quick Ratio: Operating Cash Flow to Current Liabilities Ratio: Days Accounts Receivable: Days Inventory: Days Accounts Payable: Net Days Working Capital: Ratio Liabilities to Assets Ratio: Liabilities to Shareholders' Equity Ratio: Long-Term Debt Ratio to Long-Term Capital Ratio: Long-Term Debt to Shareholders' Equity Ratio: Operating Cash Flow to Total Liabilities Ratio: Interest Coverage Ratio: Focus RA
Step by Step Solution
There are 3 Steps involved in it

Get step-by-step solutions from verified subject matter experts