

Question: 4h 2 Below are four bivariate data sets and their scatter plots. (Note that all of the scatter plots are displayed with the same scale.
4h 2
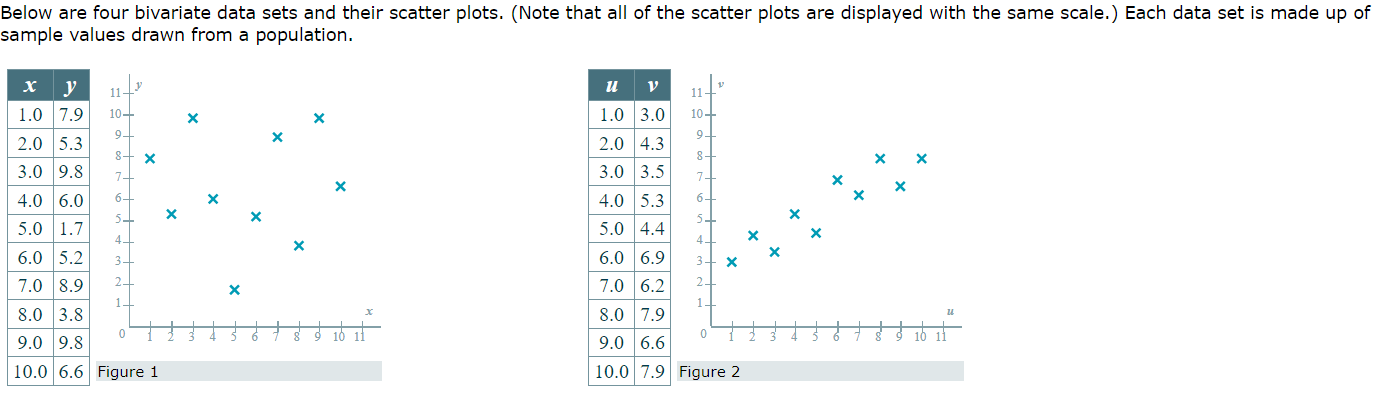
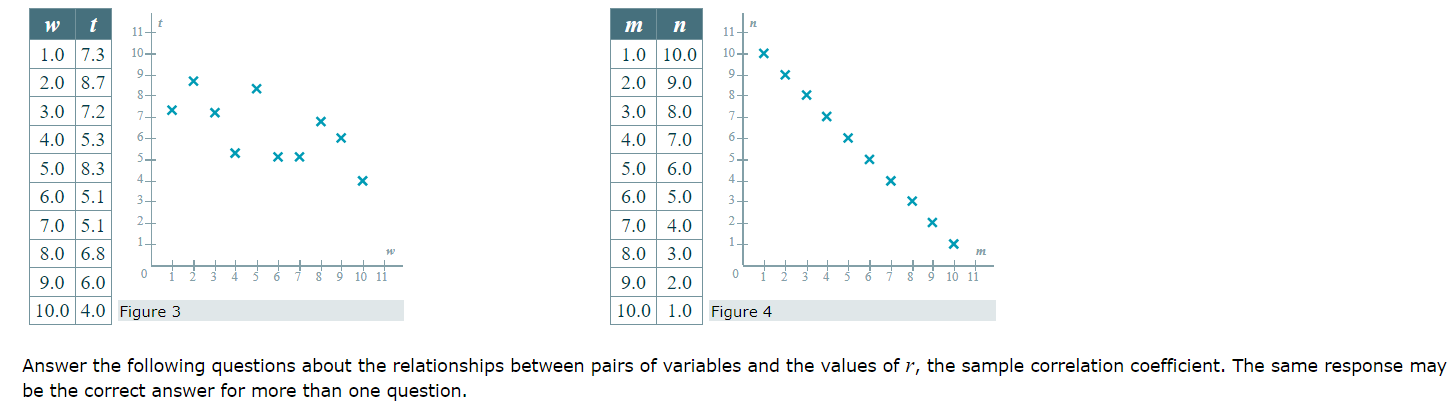


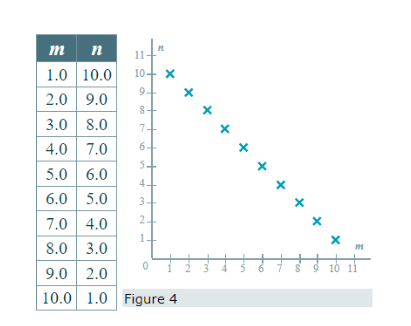

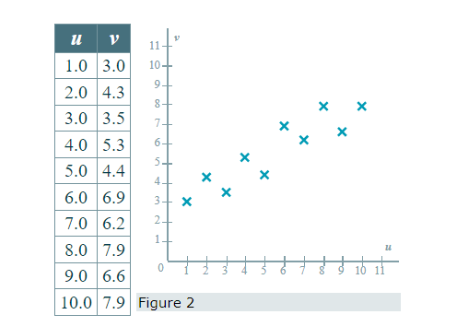
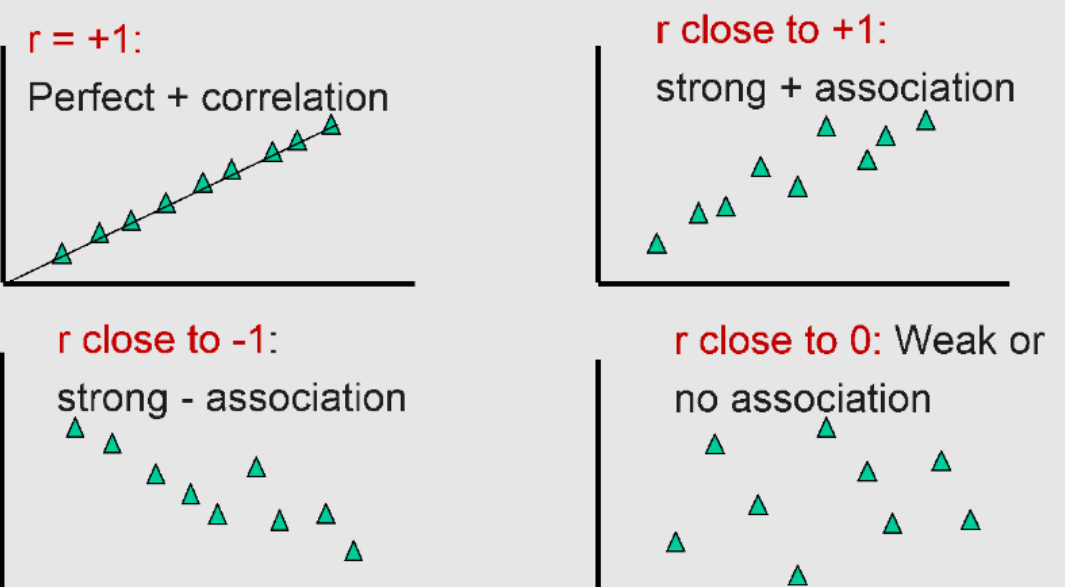
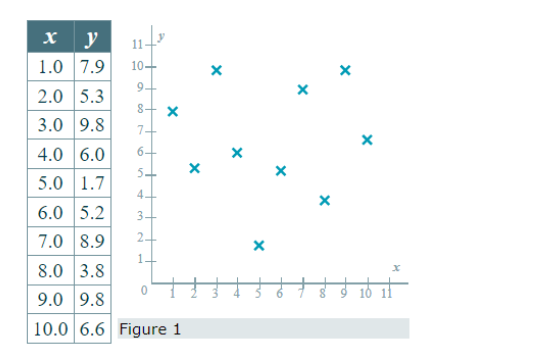
Below are four bivariate data sets and their scatter plots. (Note that all of the scatter plots are displayed with the same scale. ) Each data set is made up of sample values drawn from a population. X y V 11 - 1.0 7.9 10- X X 1.0 3.0 10_ 9_ 2.0 5.3 X 2.0 4.3 8-+ X 8- X X 3.0 9.8 7- 3.0 3.5 7- X X X 4.0 6.0 6- X 4.0 5.3 6- X X X X 5.0 1.7 5.0 4.4 X X X 4_ 6.0 5.2 6.0 6.9 X 3 - X 7.0 8.9 X 7.0 6.2 2_ 8.0 3.8 8.0 7.9 9.0 9.8 9.0 6.6 10.0 6.6 Figure 1 10.0 7.9 Figure 2W t 11- in 11 1.0 7.3 10- 1.0 10.0 10- X 9_ X 2.0 8.7 X 2.0 8- X 9.0 X 3.0 7.2 7- X X 3.0 8.0 X X 4.0 5.3 6- X 4.0 7.0 X X X X X 5.0 8.3 5.0 6.0 X 6.0 5.1 3- 6.0 5.0 X 7.0 5.1 7.0 4.0 X X 8.0 6.8 8.0 3.0 m 9.0 6.0 9 10 11 9.0 2.0 9 10 11 10.0 4.0 Figure 3 10.0 |1.0 Figure 4 Answer the following questions about the relationships between pairs of variables and the values of , the sample correlation coefficient. The same response may be the correct answer for more than one question.(a) Which data set has an apparent positive, but net perfect, linear relationship between its two variables? (b) For which data set is the sample correlation coefficient / closest to 0?(d) For which data set is the sample correlation coefficient / equal to 1?(c) Which data set indicates the strongest positive linear relationship between its two variables? 11 + 1.0 10.0 10 X 2.0 9.0 X S- X 3.0 8.0 7- X 4.0 7.0 X X 5.0 6.0 X 6.0 5.0 X 7.0 4.0 2- X X 8.0 3.0 0 9.0 2.0 10 11 10.0 1.0 Figure 4V 11- 1.0 3.0 10 4 2.0 4.3 8 X X 3.0 3.5 7- X X 4.0 5.3 6- X X 5.0 4.4 X X 4 6.0 6.9 X X 7.0 6.2 2_ 8.0 7.9 0 9.0 6.6 $ 1 3 8 7 8 8 10 11 10.0 7.9 Figure 2V 11- 1.0 3.0 10 4 2.0 4.3 8 X X 3.0 3.5 7- X X 4.0 5.3 6- X X 5.0 4.4 X X 4 6.0 6.9 X X 7.0 6.2 2_ 8.0 7.9 0 9.0 6.6 $ 1 3 8 7 8 8 10 11 10.0 7.9 Figure 2r = +1: r close to +1: Perfect + correlation strong + association r close to -1: r close to 0: Weak or strong - association no association A AX y 11- 1.0 7.9 10 4 X X 9- 2.0 5.3 X 8+ X 3.0 9.8 7-+ X 4.0 6.0 6- X 5- X X 5.0 1.7 4. X 6.0 5.2 3- 7.0 8.9 2- X 8.0 3.8 9.0 9.8 13 6 + 8 8 10 14 10.0 6.6 Figure 1
Step by Step Solution
There are 3 Steps involved in it

Get step-by-step solutions from verified subject matter experts