

Question: 5. (15pts) Using the table below: a. Plot the points in a graphing paper b. Find the regression line and correlation between the stride length,
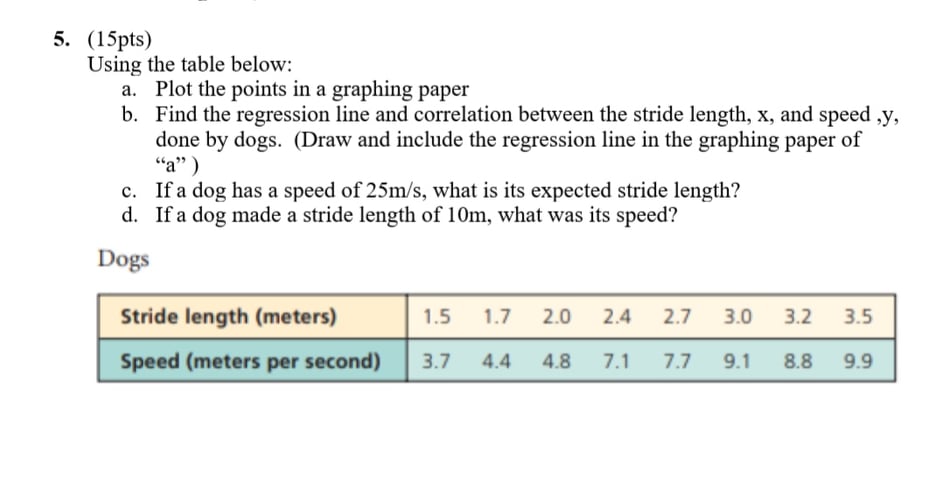

5. (15pts) Using the table below: a. Plot the points in a graphing paper b. Find the regression line and correlation between the stride length, x, and speed ,y, done by dogs. (Draw and include the regression line in the graphing paper of "a" ) c. If a dog has a speed of 25m/s, what is its expected stride length? d. If a dog made a stride length of 10m, what was its speed? Dogs Stride length (meters) 1.5 1.7 2.0 2.4 2.7 3.0 3.2 3.5 Speed (meters per second) 3.7 4.4 4.8 7.1 7.7 9.1 8.8 9.9
Step by Step Solution
There are 3 Steps involved in it
1 Expert Approved Answer
Step: 1 Unlock

Question Has Been Solved by an Expert!
Get step-by-step solutions from verified subject matter experts
Step: 2 Unlock
Step: 3 Unlock