

Question: I want C, F,G,H,I,J I provided A, B, D, E answer A marketing manager conducted a study to determine whether there is a linear relationship
I want C, F,G,H,I,J
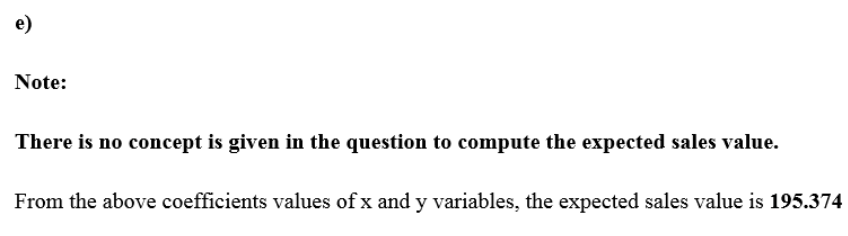
I provided A, B, D, E answer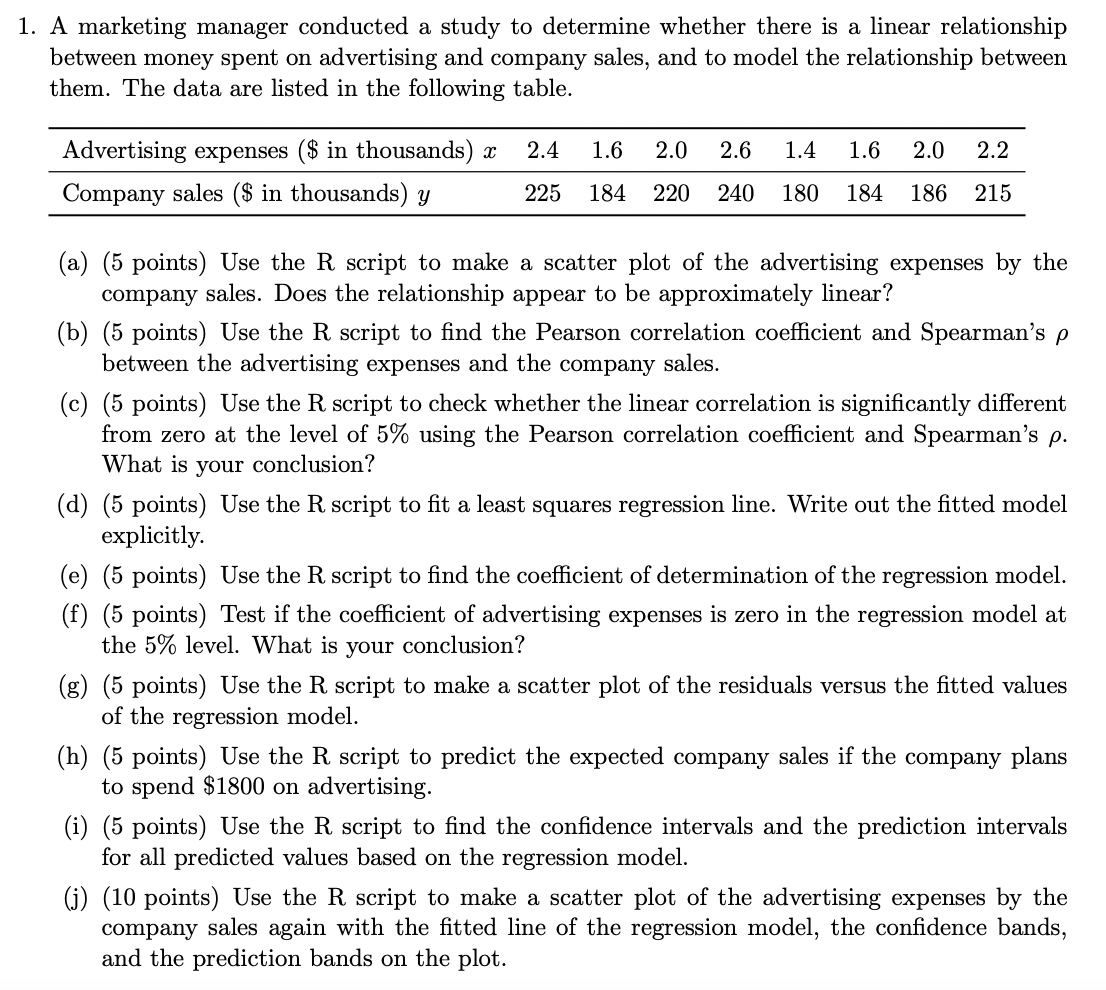
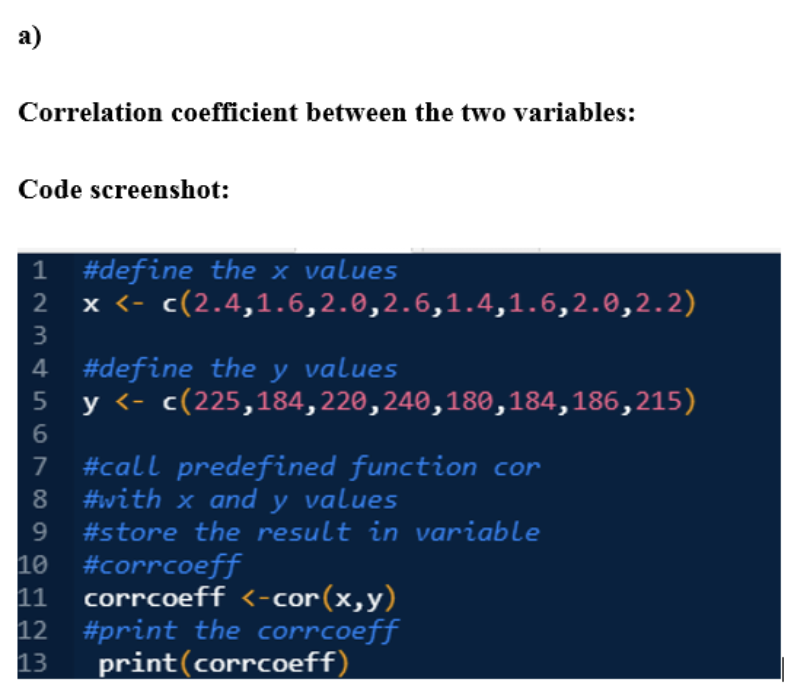
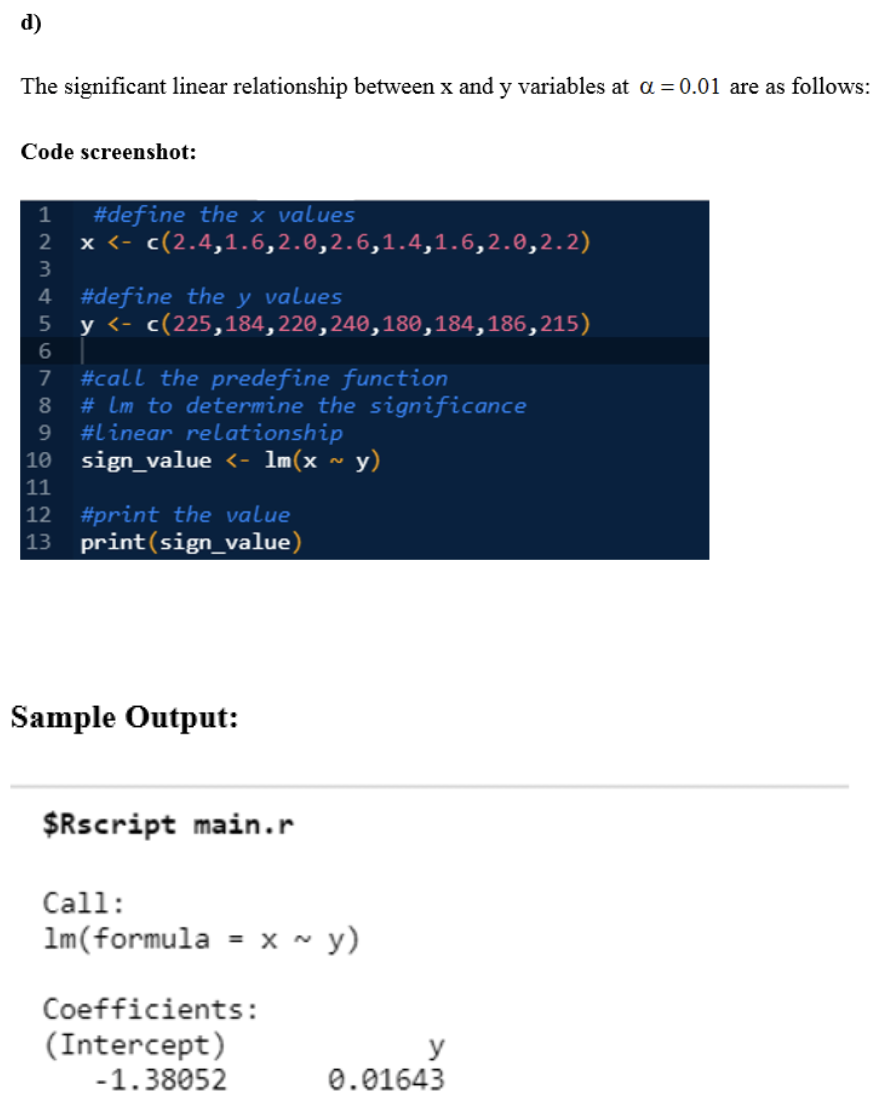
A marketing manager conducted a study to determine whether there is a linear relationship between money spent on advertising and company sales, and to model the relationship between them. The data are listed in the following table. (a) (5 points) Use the R script to make a scatter plot of the advertising expenses by the company sales. Does the relationship appear to be approximately linear? (b) (5 points) Use the R script to find the Pearson correlation coefficient and Spearman's between the advertising expenses and the company sales. (c) (5 points) Use the R script to check whether the linear correlation is significantly different from zero at the level of 5% using the Pearson correlation coefficient and Spearman's . What is your conclusion? (d) (5 points) Use the R script to fit a least squares regression line. Write out the fitted model explicitly. (e) (5 points) Use the R script to find the coefficient of determination of the regression model. (f) (5 points) Test if the coefficient of advertising expenses is zero in the regression model at the 5% level. What is your conclusion? (g) (5 points) Use the R script to make a scatter plot of the residuals versus the fitted values of the regression model. (h) (5 points) Use the R script to predict the expected company sales if the company plans to spend $1800 on advertising. (i) (5 points) Use the R script to find the confidence intervals and the prediction intervals for all predicted values based on the regression model. (j) (10 points) Use the R script to make a scatter plot of the advertising expenses by the company sales again with the fitted line of the regression model, the confidence bands, Correlation coefficient between the two variables: Code screenshot: #define the x values x
Step by Step Solution
There are 3 Steps involved in it

Get step-by-step solutions from verified subject matter experts