

Question: 5. [3/14.5 Points] DETAILS PREVIOUS ANSWERS MY NOTES PRACTICE ANOTHER The University of California, Berkeley wanted to analyze information on it's admission rates in the
![5. [3/14.5 Points] DETAILS PREVIOUS ANSWERS MY NOTES PRACTICE ANOTHER The](https://s3.amazonaws.com/si.experts.images/answers/2024/06/667ede08538df_408667ede0831f3f.jpg)
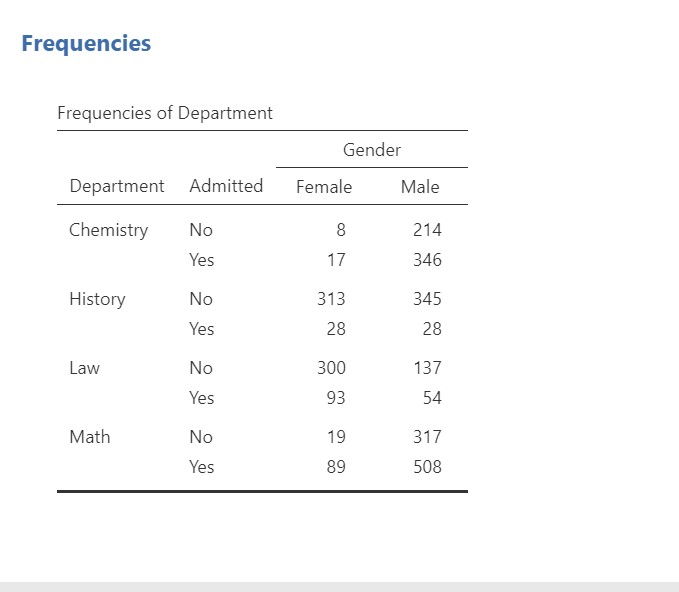
5. [3/14.5 Points] DETAILS PREVIOUS ANSWERS MY NOTES PRACTICE ANOTHER The University of California, Berkeley wanted to analyze information on it's admission rates in the fall of 1973. They noticed that the graduate schools had a higher admittance rate among males than females. As soon as they saw this they worried about being sued, Standard deviation No and checked in with each individual department. To their surprise, they noticed that within most departments the admittance rate Yes among females tended to be higher than it was among males. How could this be? Minimum No Download the file called BerkleyAdmissions on Canvas and open it in Jamovi. There are 10 versions; the version you should use Yes is version 8. In order to simplify our analysis we will look at a small sample of the programs: Math, Chemistry, Law, and History. Maximum No Round all answers to 4 decimal places. You have 5 attempts on numeri attempt on drop down answers. Remember Yes to check and save work by submitting answers as you go. 1. In Jamovi go to Exploration> Descriptives. Move the variable Gender into the Variables box. Click the Frequency tables option below the list of all variables. a. What percent of applicants are male? |89.2 . What percent of applicants are female? 30.8 Frequencies 2. Move the Gender variable back and do the same process for the variable Admitted. a. What percen re admitted overall? |41.3 3. Now we want to create a table with gender and admittance at the same time by putting gender in the rows and admittance in the Frequencies of Gender columns. To do this, put Gender in the Variables box and Admitted in the Split by box. a. P(Admitted| Male)= Admitted . P(Admitted | Female) =[ . Based on these probabilities it seems that - have a higher acceptance rate. Gender No Yes 4. Now let's add the departments to the table. Move Department into the Variables box and Admitted and Gender into the Split by box. Female 640 227 Admitted Gender No All Male 1013 936 3 734 067 . For the Math department: P(Admitted | Male): (Admitted | Female): Based on these probabilities it seems that [-- have a higher acceptance rate in this department. b. For the Chemistry department: P(Admitted | Male): P(Admitted | Female): Based on these probabilities it seems that [-- have a higher acceptance rate in this department. C. For the Law department: P(Admitted | Male): P(Admitted | Female): Based on these probabilities it seems that _-- have a higher acceptance rate in this department. d. For the History department: P(Admitted | Male): P(Admitted | Female):Frequencies Frequencies of Department Gender Department Admitted Female Male Chemistry No 8 214 Yes 17 346 History No 313 345 Yes 28 28 Law No 300 137 Yes 93 54 Math No 19 317 Yes 89 508
Step by Step Solution
There are 3 Steps involved in it

Get step-by-step solutions from verified subject matter experts