

Question: 5. [-/5.31 Points] DETAILS BBUNDERSTAT12 9.2.005.MI. MY NOTES ASK YOUR TEACHER We use the form y=a+ bx for the least-squares line. In some computer printouts,
![5. [-/5.31 Points] DETAILS BBUNDERSTAT12 9.2.005.MI. MY NOTES ASK YOUR TEACHER](https://dsd5zvtm8ll6.cloudfront.net/si.experts.images/questions/2024/10/67090662df884_706670906629fe94.jpg)
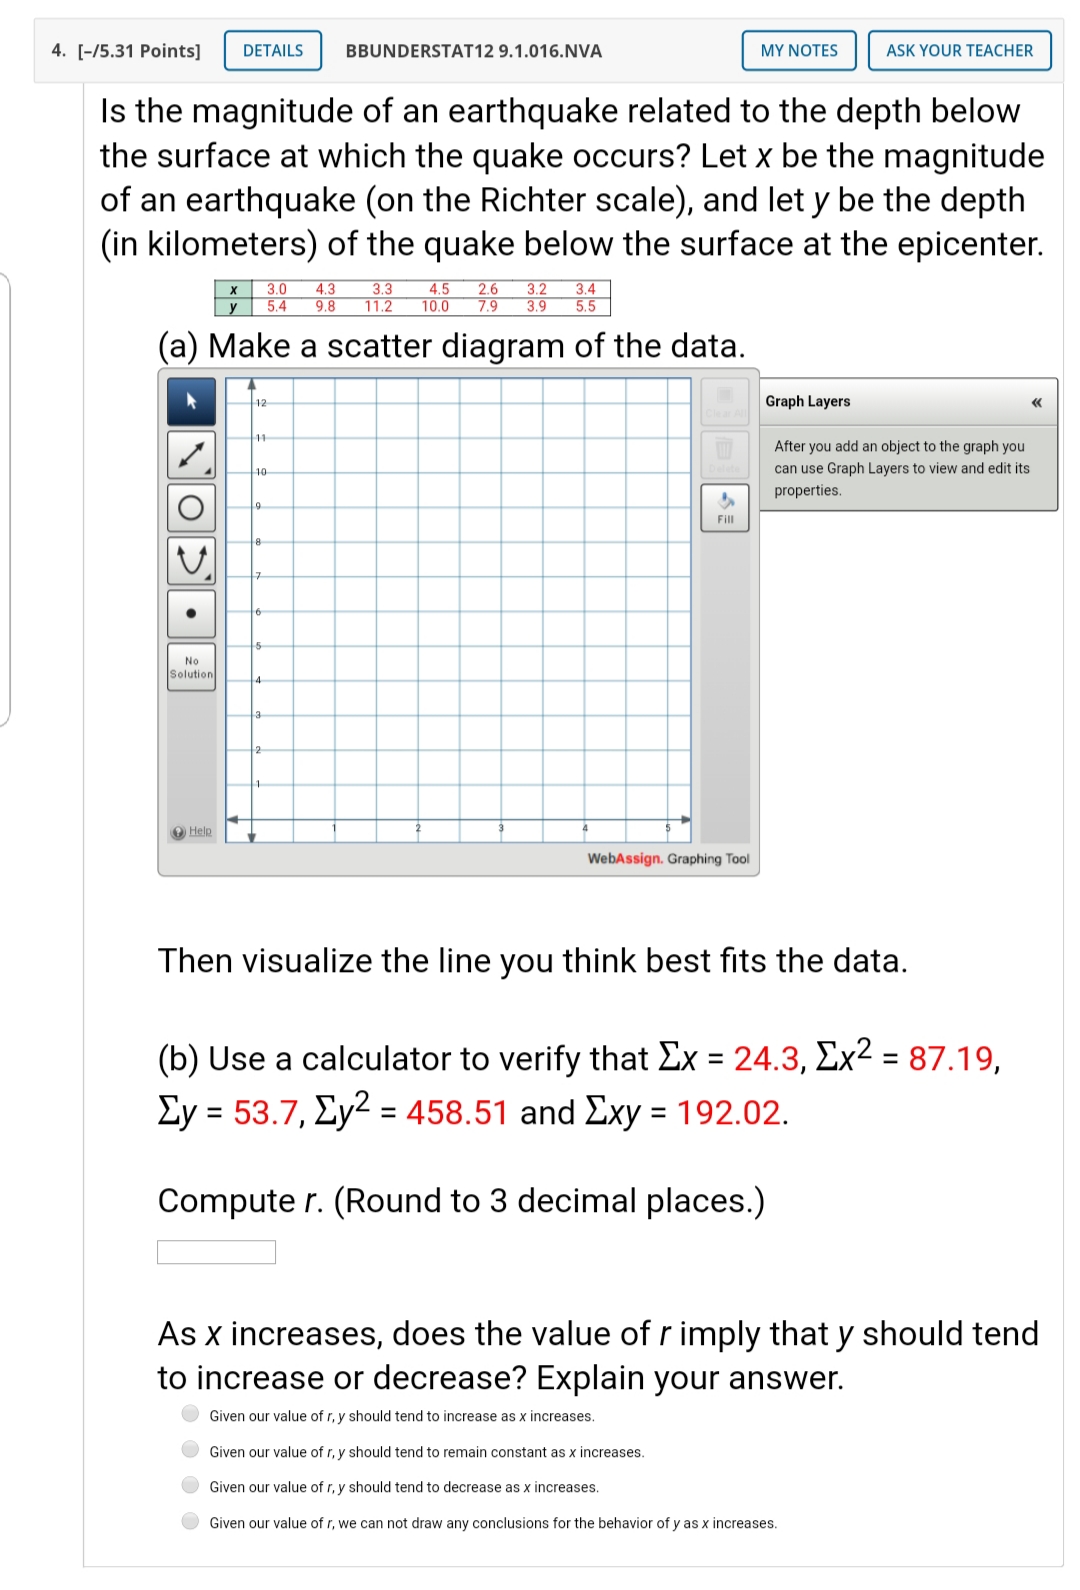
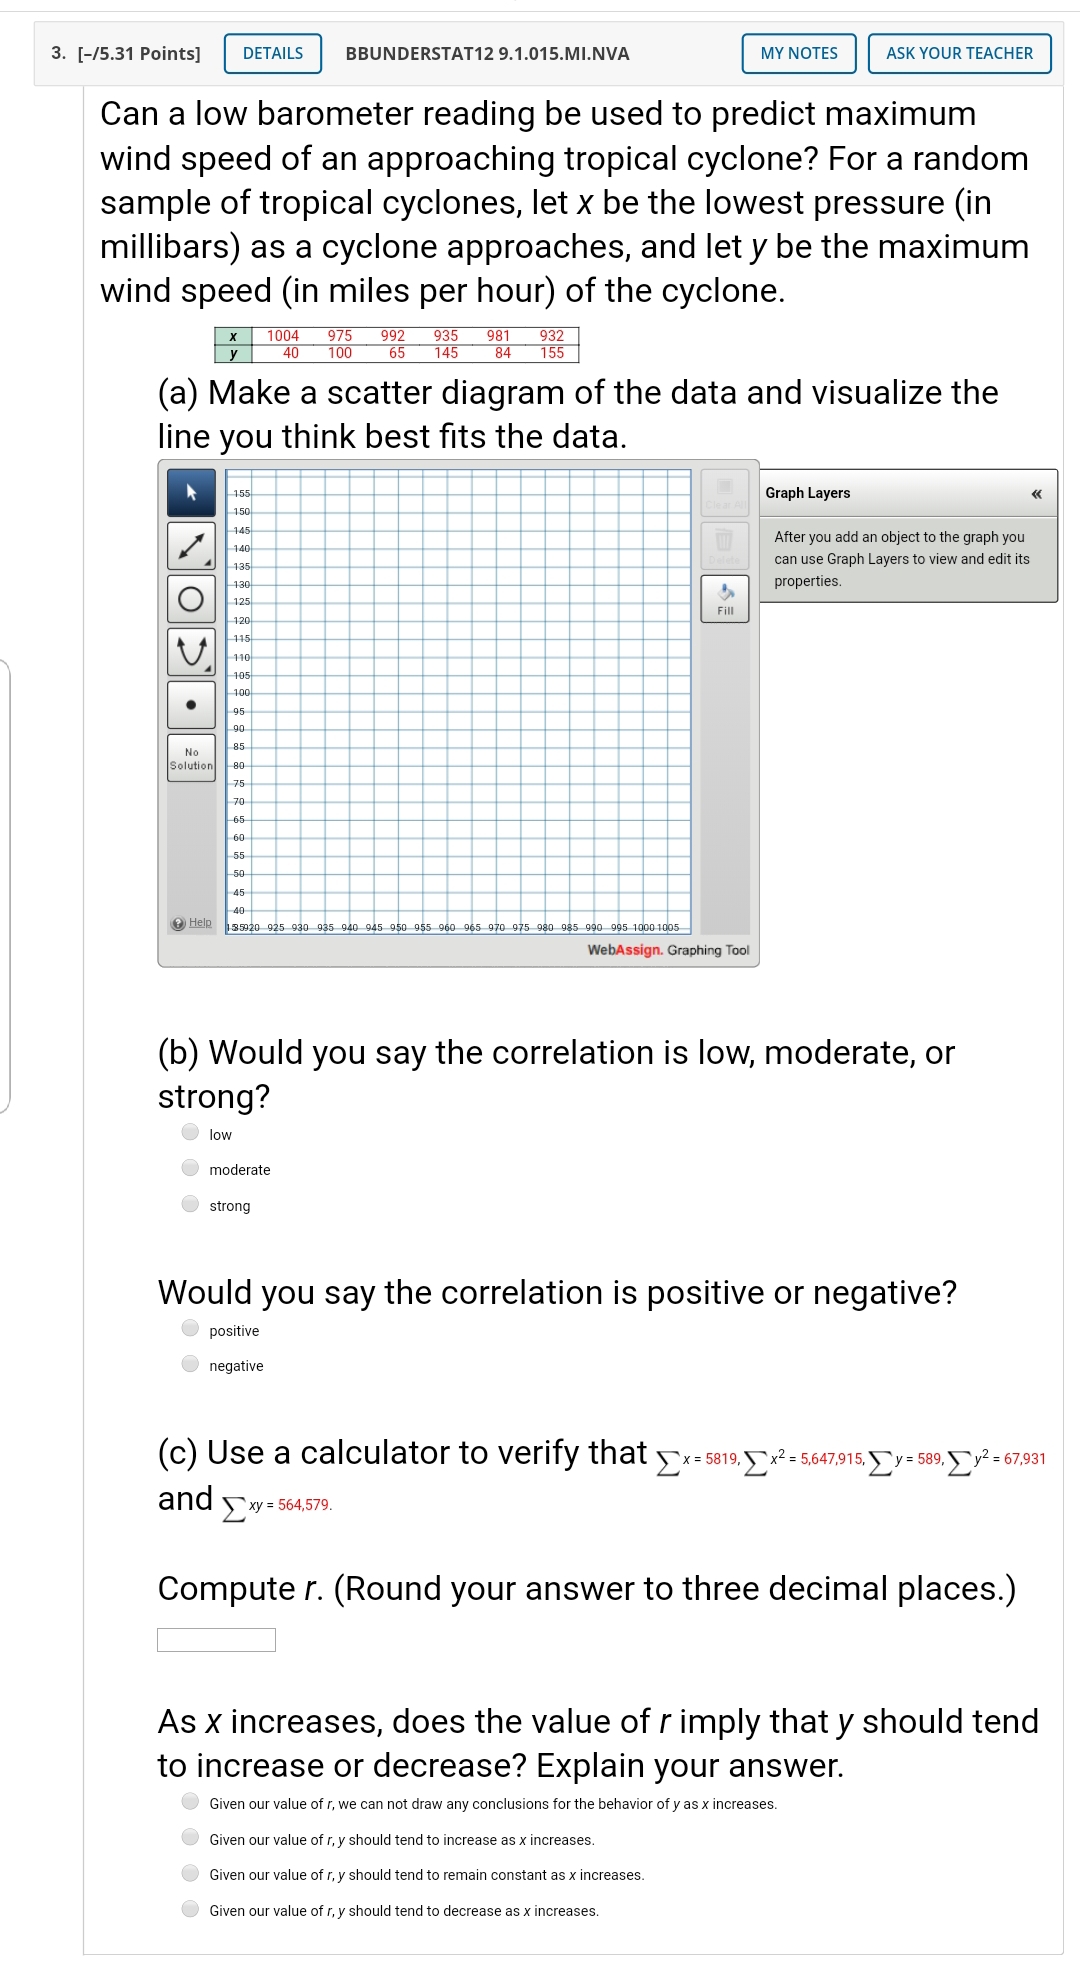
5. [-/5.31 Points] DETAILS BBUNDERSTAT12 9.2.005.MI. MY NOTES ASK YOUR TEACHER We use the form y=a+ bx for the least-squares line. In some computer printouts, the least-squares equation is not given directly. Instead, the value of the constant a is given, and the coefficient b of the explanatory or predictor variable is displayed. Sometimes a is referred to as the constant, and sometimes as the intercept. Data from a report showed the following relationship between elevation (in thousands of feet) and average number of frost-free days per year in a state. A Minitab printout provides the following information. Predictor Coef SE Coef Constant 316.35 28 .31 11. 24 0 . 002 Elevation - 29. 706 3 . 511 - 8. 79 0. 003 S = 11. 8603 R- Sq = 95. 0% Notice that "Elevation" is listed under "Predictor." This means that elevation is the explanatory variable x. Its coefficient is the slope b. "Constant" refers to a in the equation ,= a+bx. (a) Use the printout to write the least-squares equation. (b) For each 1000-foot increase in elevation, how many fewer frost-free days are predicted? (Round your answer to three decimal places.) (c) The printout gives the value of the coefficient of determination r2. What is the value of r? Be sure to give the correct sign for r based on the sign of b. (Round your answer to four decimal places.) (d) What percentage of the variation in y can be explained by the corresponding variation in x and the least-squares line? % What percentage is unexplained? %4. [-/5.31 Points] DETAILS BBUNDERSTAT12 9.1.016.NVA MY NOTES ASK YOUR TEACHER Is the magnitude of an earthquake related to the depth below the surface at which the quake occurs? Let x be the magnitude of an earthquake (on the Richter scale), and let y be the depth (in kilometers) of the quake below the surface at the epicenter. 4 .3 3 .3 10.0 3.3 (a) Make a scatter diagram of the data. Graph Layers After you add an object to the graph you can use Graph Layers to view and edit its O properties. Fill V No Solution Help WebAssign. Graphing Tool Then visualize the line you think best fits the data. (b) Use a calculator to verify that Ex = 24.3, Ex2 = 87.19, Zy = 53.7, Zy2 = 458.51 and Exy = 192.02. Computer. (Round to 3 decimal places.) As x increases, does the value of r imply that y should tend to increase or decrease? Explain your answer. Given our value of r, y should tend to increase as x increases. Given our value of r, y should tend to remain constant as x increases. Given our value of r, y should tend to decrease as x increases. Given our value of r, we can not draw any conclusions for the behavior of y as x increases.3. [-/5.31 Points] DETAILS BBUNDERSTAT12 9.1.015.MI.NVA MY NOTES ASK YOUR TEACHER Can a low barometer reading be used to predict maximum wind speed of an approaching tropical cyclone? For a random sample of tropical cyclones, let x be the lowest pressure (in millibars) as a cyclone approaches, and let y be the maximum wind speed (in miles per hour) of the cyclone. 1004 40 975 100 992 935 981 932 155 (a) Make a scatter diagram of the data and visualize the line you think best fits the data. 155 Graph Layers 150 After you add an object to the graph you can use Graph Layers to view and edit its properties. O 125 120 Fill V 140 105 100 No Solution -50 -45 35920 925 930 935 940 945 950 955 960 965 970 975 980 985 990 995 1000-1805 WebAssign. Graphing Tool (b) Would you say the correlation is low, moderate, or strong? low moderate strong Would you say the correlation is positive or negative? positive negative (c) Use a calculator to verify that >x=5819, )x2 = 5,647,915, > >=589, ) 2 =67,931 and > xy= 564,579. Computer. (Round your answer to three decimal places.) As x increases, does the value of r imply that y should tend to increase or decrease? Explain your answer. Given our value of r, we can not draw any conclusions for the behavior of y as x increases. Given our value of r, y should tend to increase as x increases. Given our value of r, y should tend to remain constant as x increases. Given our value of r, y should tend to decrease as x increases
Step by Step Solution
There are 3 Steps involved in it

Get step-by-step solutions from verified subject matter experts