

Question: 5} Below are the production graphs for two countries, Up and Down. Each country produces only 2 goods {at quantities they believe is the optimum

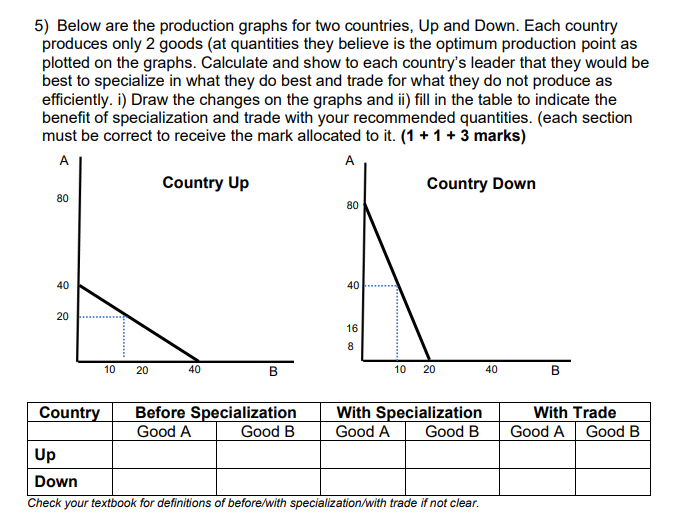
5} Below are the production graphs for two countries, Up and Down. Each country produces only 2 goods {at quantities they believe is the optimum production point as plotted on the graphs. Calculate and show to each country's leader that they would be best to specialize in what they do best and trade for what they do not produce as efciently. i) Draw the changes on the graphs and ii) ll in the table to indicate the benet of specialization and trade with your recommended quantities. {each section must be correct to receive the mark allocated to it. {1 + 1 + 3 marks) A A Country Up Country Down SCI EU 4o 40 20 1D 2D 40 B 1i]l 2D 40 B Before 5 aecialization With 3 - eciallzatlon With Trade Check your tempest: for denitions of heforae'wi'th spectaiizatronfwlth trade it not clear
Step by Step Solution
There are 3 Steps involved in it

Get step-by-step solutions from verified subject matter experts