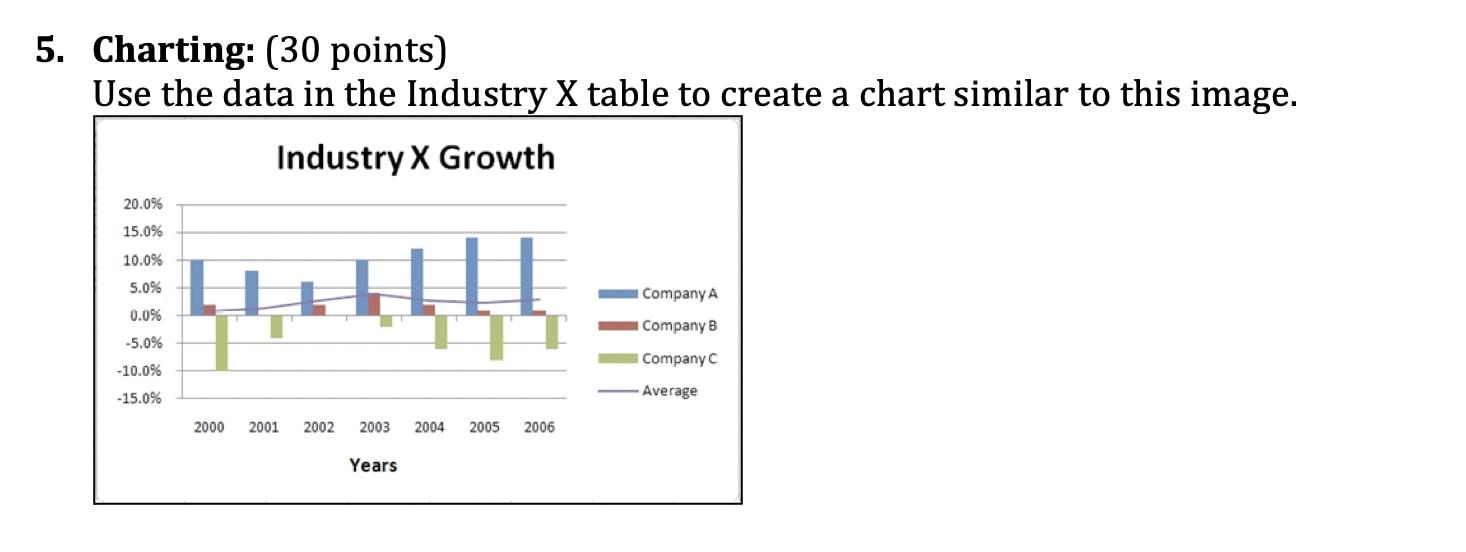
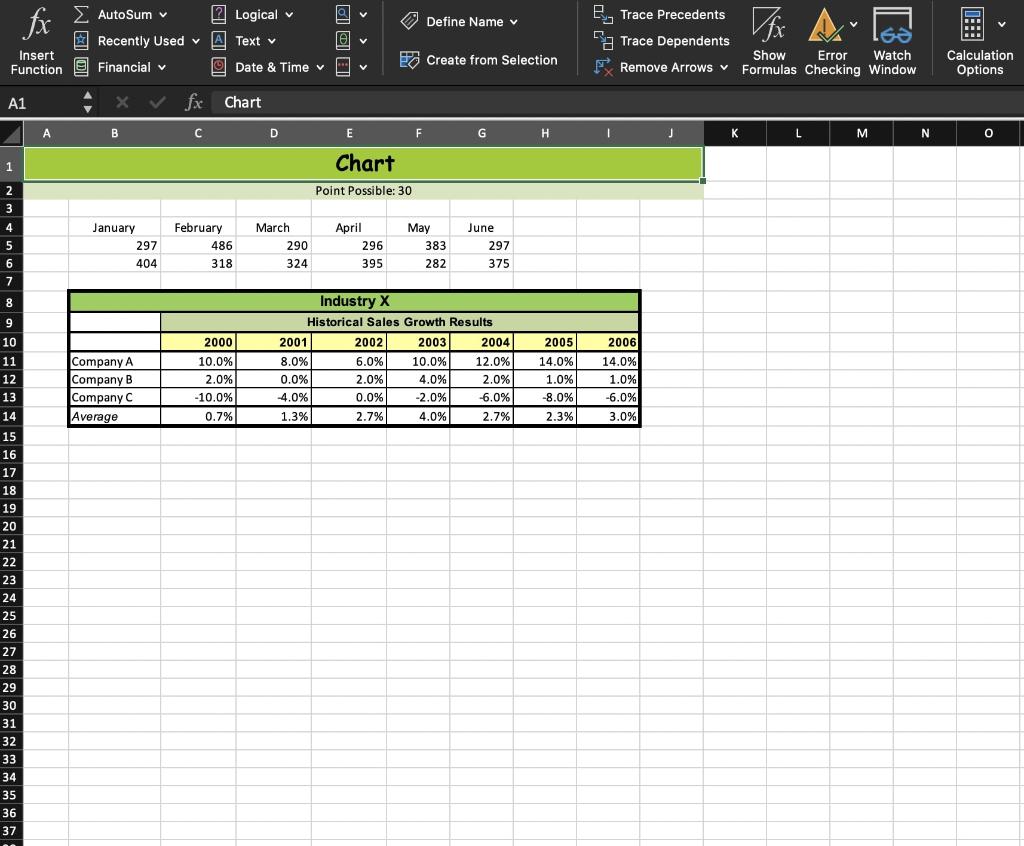
Question: 5. Charting: (30 points) Use the data in the Industry X table to create a chart similar to this image. Industry X Growth 20.0% 15.0%

5. Charting: (30 points) Use the data in the5. Charting: (30 points) Use the data in the

5. Charting: (30 points) Use the data in the Industry X table to create a chart similar to this image. Industry X Growth 20.0% 15.0% 10.0% 5.0% Company A 0.0% Company B -5.0% -10.0% -15.0% Company C Average 2000 2001 2002 2003 2004 2005 2006 Years AutoSum 9 Define Name Logical A Text Dfx le Recently Used Insert Function e Financial B Trace Precedents a a Trace Dependents Show Error Watch FRemove Arrows Formulas Checking Window O Date & Time v Create from Selection Calculation Options A1 fx Chart A B C D E F G 1 J L M N O 1 Chart Point Possible: 30 2 3 4 5 6 7 8 January 297 404 February 486 318 March 290 324 April 296 395 May 383 282 June 297 375 2000 2005 Company A Company B Company C Average 10.0% 2.0% -10.0% 0.7% Industry X Historical Sales Growth Results 2001 2002 2003 2004 8.0% 6.0% 10.0% 12.0% 0.0% 2.0% 4.0% 2.0% 4.0% 0.0% -2.0% -6.0% 1.3% 2.7% 4.0% 2.7% 14.0% 1.0% -8.0% 2006 14.0% 1.0% -6.0% 3.0% 2.3% 9 10 11 12 13 14 15 16 17 18 19 20 21 22 23 24 25 26 27 28 29 30 31 32 33 34 35 36 37

Step by Step Solution

There are 3 Steps involved in it

1 Expert Approved Answer
Step: 1 Unlock blur-text-image
Question Has Been Solved by an Expert!

Get step-by-step solutions from verified subject matter experts

Step: 2 Unlock
Step: 3 Unlock

Students Have Also Explored These Related General Management Questions!