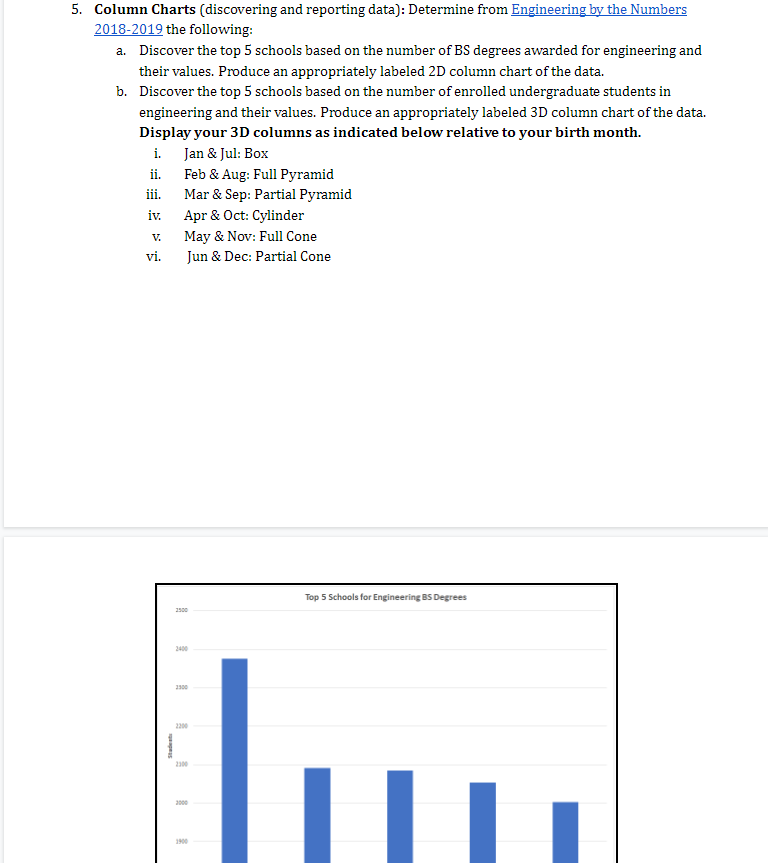
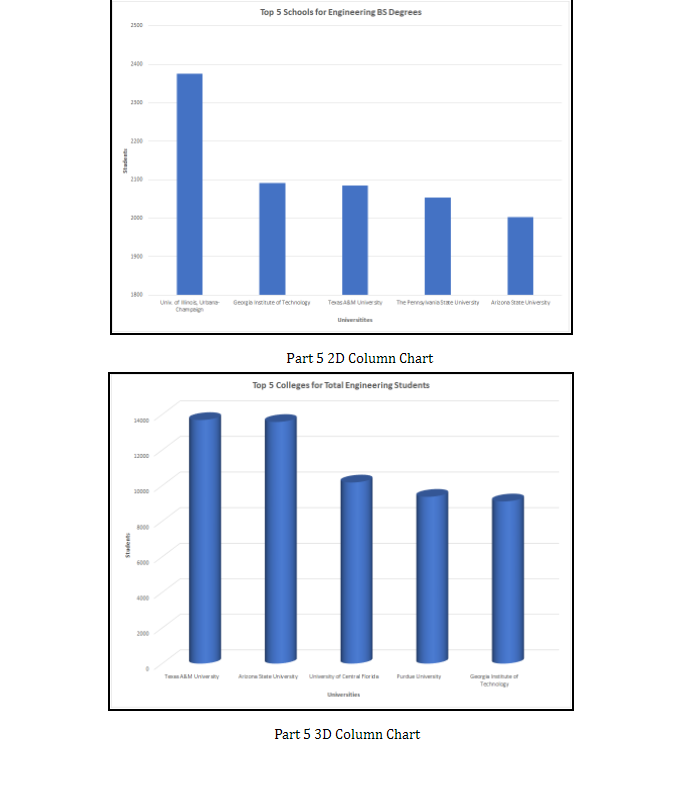
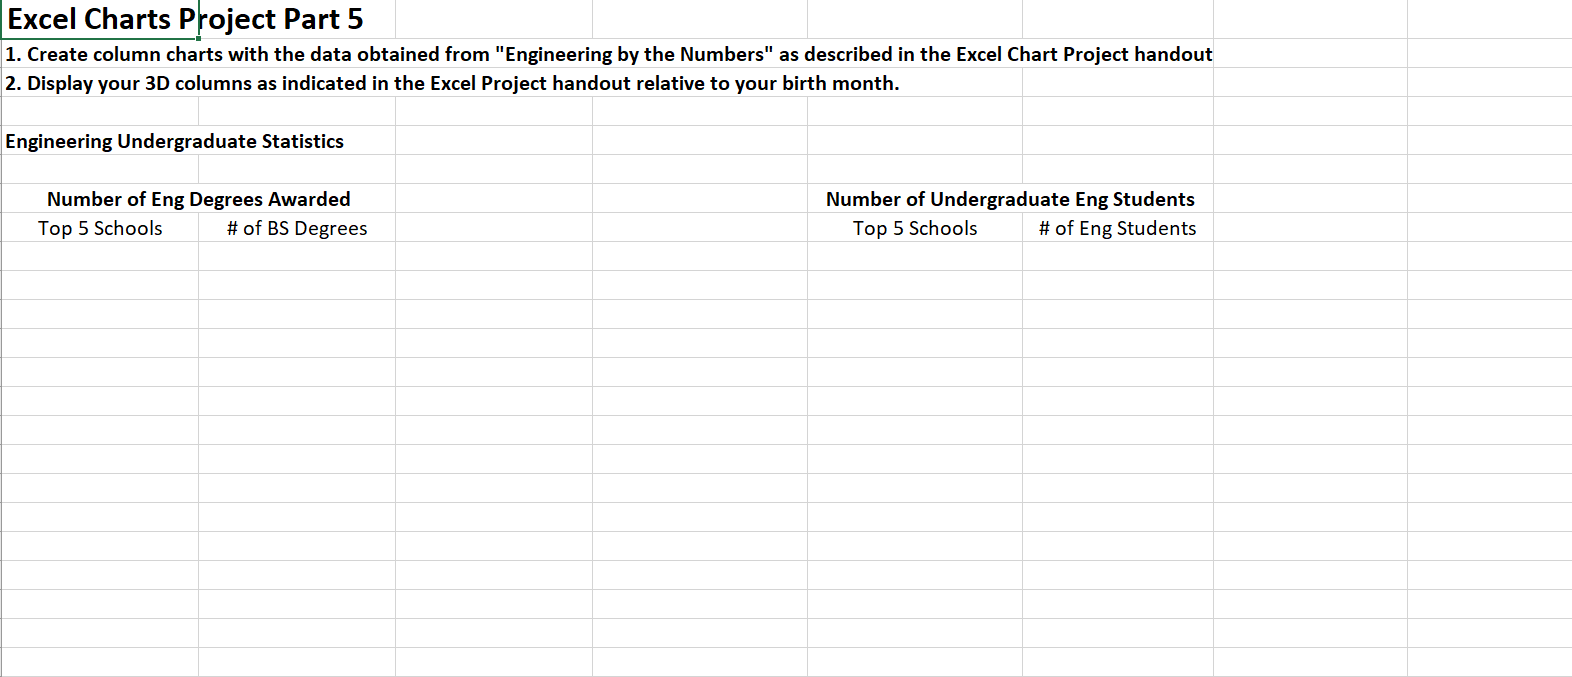
Question: 5. Column Charts (discovering and reporting data): Determine from Engineering by the Numbers 2018-2019 the following: a. Discover the top 5 schools based on the

5. Column Charts (discovering and reporting5. Column Charts (discovering and reporting5. Column Charts (discovering and reporting

5. Column Charts (discovering and reporting data): Determine from Engineering by the Numbers 2018-2019 the following: a. Discover the top 5 schools based on the number of BS degrees awarded for engineering and their values. Produce an appropriately labeled 2D column chart of the data. b. Discover the top 5 schools based on the number of enrolled undergraduate students in engineering and their values. Produce an appropriately labeled 3D column chart of the data. Display your 3D columns as indicated below relative to your birth month. i. Jan & Jul: Box ii. Feb & Aug: Full Pyramid iii. Mar & Sep: Partial Pyramid iv. Apr & Oct: Cylinder May & Nov: Full Cone vi. Jun & Dec: Partial Cone Top 5 Schools for Engineering BS Degrees 2500 2400 3300 1 2300 2000 Top 5 Schools for Engineering BS Degrees 2500 2400 2200 23 3000 III 2900 Unik George TAMUS The Pete Universty Arcore State University Part 5 2D Column Chart Top 5 Colleges for Total Engineering Students 34000 2000 TEAM Part 5 3D Column Chart Excel Charts Project Part 5 1. Create column charts with the data obtained from "Engineering by the Numbers" as described in the Excel Chart Project handout 2. Display your 3D columns as indicated in the Excel Project handout relative to your birth month. Engineering Undergraduate Statistics Number of Eng Degrees Awarded Top 5 Schools # of BS Degrees Number of Undergraduate Eng Students Top 5 Schools # of Eng Students

Step by Step Solution

There are 3 Steps involved in it

1 Expert Approved Answer
Step: 1 Unlock blur-text-image
Question Has Been Solved by an Expert!

Get step-by-step solutions from verified subject matter experts

Step: 2 Unlock
Step: 3 Unlock

Students Have Also Explored These Related General Management Questions!