

Question: 5. How many different slopes are on this graph (below)? What do they represent? Below a graph that shows taxes paid as a function of
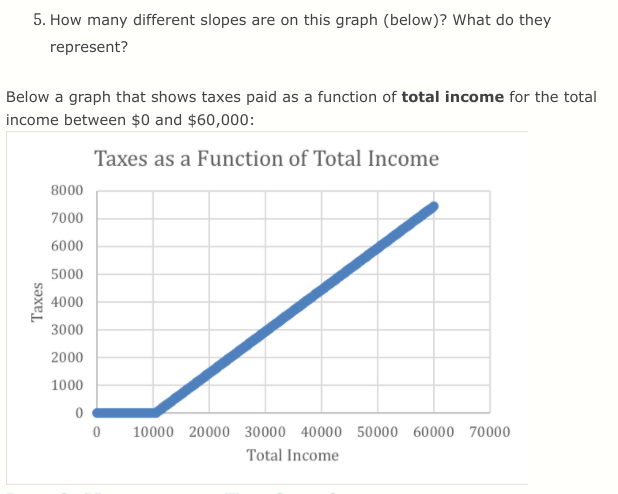
5. How many different slopes are on this graph (below)? What do they represent? Below a graph that shows taxes paid as a function of total income for the total income between $0 and $60,000: Taxes as a Function of Total Income 8000 7000 6000 5000 Taxes 4000 3000 2000 1000 0 0 10000 20000 30000 40000 50000 60000 70000 Total Income
Step by Step Solution
There are 3 Steps involved in it
1 Expert Approved Answer
Step: 1 Unlock

Question Has Been Solved by an Expert!
Get step-by-step solutions from verified subject matter experts
Step: 2 Unlock
Step: 3 Unlock