

Question: 5. Label Graph 1. Using the mean and standard deviation from Chart 3, label the mean. Then label up to 3 standard deviations above and
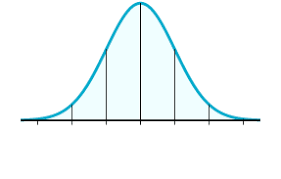
5. Label Graph 1. Using the mean and standard deviation from Chart 3, label the mean. Then label up to 3 standard deviations above and below the mean.


Step by Step Solution
There are 3 Steps involved in it
1 Expert Approved Answer
Step: 1 Unlock

Question Has Been Solved by an Expert!
Get step-by-step solutions from verified subject matter experts
Step: 2 Unlock
Step: 3 Unlock