

Question: 5) Load the file called Exp3Part5.mat. This data file contains: a. A vector called ms, which is a speech signal sampled with $ =1/96E3 s.

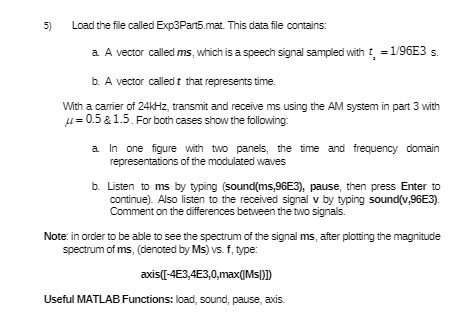
5) Load the file called Exp3Part5.mat. This data file contains: a. A vector called ms, which is a speech signal sampled with $ =1/96E3 s. b. A vector called t that represents time. With a carrier of 24kHz, transmit and receive ms using the AM system in part 3 with # = 0.5 & 1.5. For both cases show the following a In one figure with two panels, the time and frequency domain representations of the modulated waves b. Listen to ms by typing (sound(ms,96E3), pause, then press Enter to continue). Also listen to the received signal v by typing sound(v,96E3). Comment on the differences between the two signals. Note: in order to be able to see the spectrum of the signal ms, after plotting the magnitude spectrum of ms, (denoted by Ms) vs. f, type: axis([-4E3,4E3,0,max( Ms[)D) Useful MATLAB Functions: load, sound, pause, axis
Step by Step Solution
There are 3 Steps involved in it

Get step-by-step solutions from verified subject matter experts