

Question: 5) Multiple regression analysis produced the following tables. Intercept x1 x1 x 2 Coefficients Standard Error t Statistic p-value 762.1533 1.852483 96.8433 0.363289 3.007943
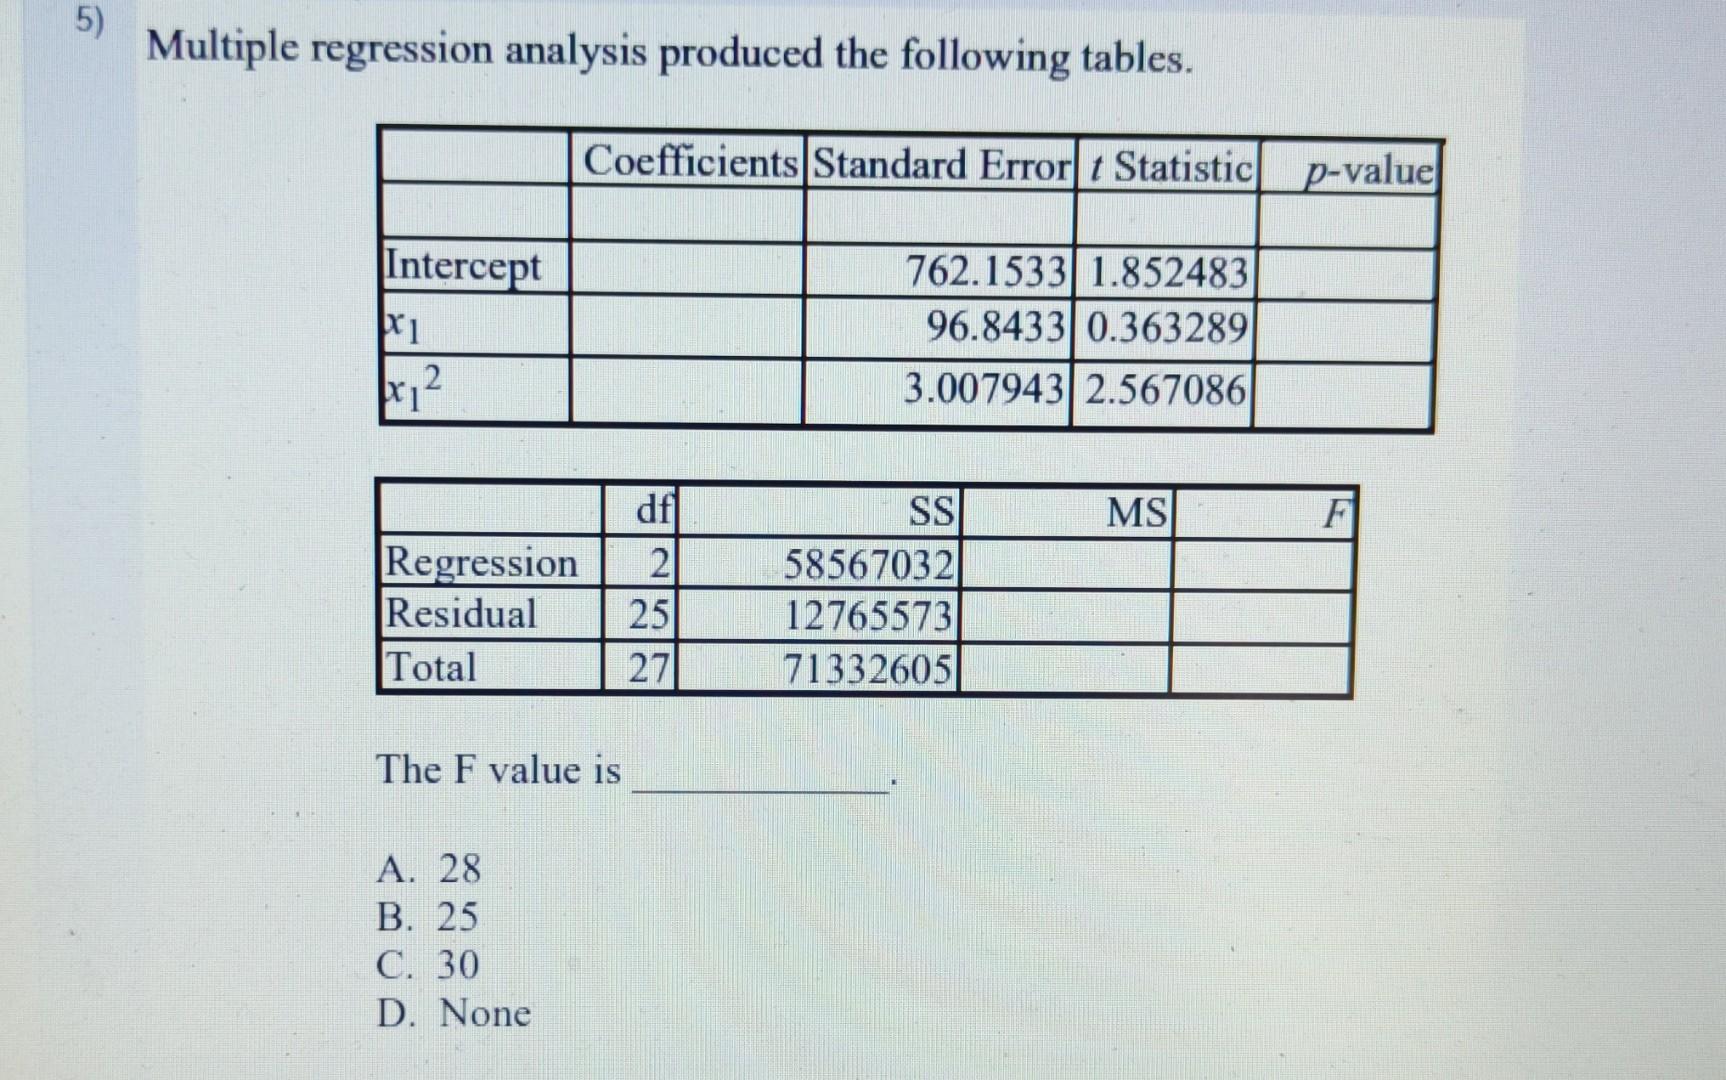
5) Multiple regression analysis produced the following tables. Intercept x1 x1 x 2 Coefficients Standard Error t Statistic p-value 762.1533 1.852483 96.8433 0.363289 3.007943 2.567086 df SS MS F Regression 2 58567032 Residual 25 12765573 Total 27 71332605 The F value is A. 28 B. 25 C. 30 D. None
Step by Step Solution
There are 3 Steps involved in it
1 Expert Approved Answer
Step: 1 Unlock

Question Has Been Solved by an Expert!
Get step-by-step solutions from verified subject matter experts
Step: 2 Unlock
Step: 3 Unlock