

Question: Multiple regression analysis in Excel produced the following tables: 1. State the multiple regression equation. 2. Interpret the meaning of the coefficients X 1 and
1. State the multiple regression equation.
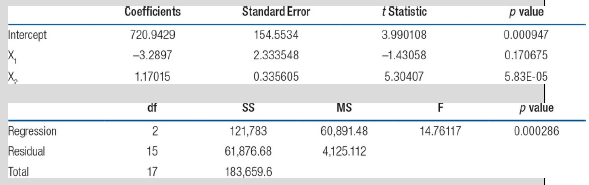
2. Interpret the meaning of the coefficients X1 and X2 in the table.
3. Forecast the value of the dependent variable if X1 = 20 and X2 = 9.
Coefficients Standard Error t Statistic p value 0.000947 720.9429 Intercept 154.5534 3.990108 2.333548 -3.2897 0.170675 -1.43058 5.83E-05 0.335605 5.30407 1.17015 X, df SS MS p value 0.000286 Regression Residual 121,783 61,876.68 183,659.6 60,891.48 4,125.112 14.76117 15 Total 17
Step by Step Solution
3.28 Rating (163 Votes )
There are 3 Steps involved in it
1 Y 7209 329 X 1 117 X 2 2 For every unit in... View full answer

Get step-by-step solutions from verified subject matter experts