

Question: A multiple regression analysis produced the following tables .N change to 18 Predictor Coefficients Standard Error t Statistic p-value Intercept 616.6849 154.5534 3.990108 0.000947 -3.33833
A multiple regression analysis produced the following tables
.N change to 18
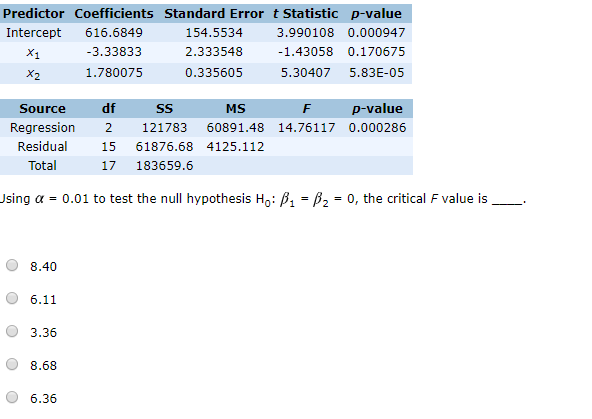
Predictor Coefficients Standard Error t Statistic p-value Intercept 616.6849 154.5534 3.990108 0.000947 -3.33833 2.333548 -1.43058 0.170675 x2 1.780075 0.335605 5.30407 5.83E-05 Source Regression Residual Total df SS MS F p-value 2 121783 60891.48 14.76117 0.000286 1561876.68 4125.112 17 183659.6 Using a -0.01 to test the null hypothesis Ho: B. = P2 = 0, the critical F value is _ O 8.40 6.11 3.36 8.68 6.36Step by Step Solution
There are 3 Steps involved in it
1 Expert Approved Answer
Step: 1 Unlock

Question Has Been Solved by an Expert!
Get step-by-step solutions from verified subject matter experts
Step: 2 Unlock
Step: 3 Unlock