

Question: 5. Plot the polarization data shown below for an electrode of 1.00cm2 of iron in an acid solution of pH=1 bubbled with pure hydrogen under
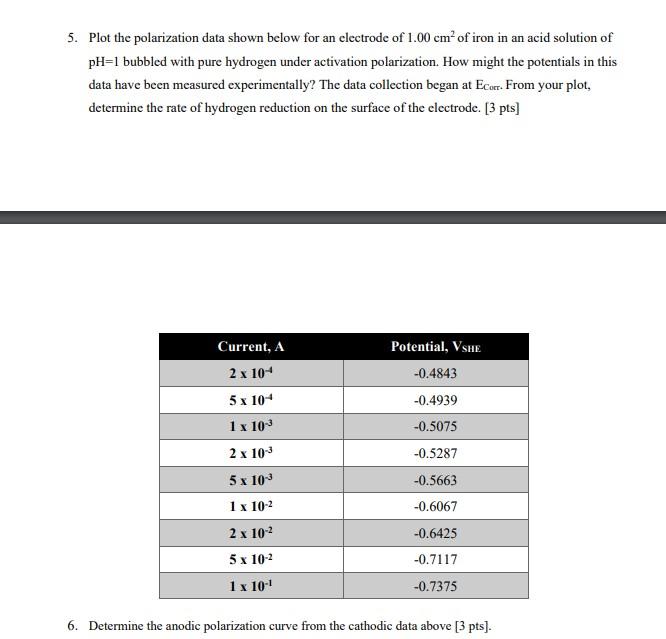
5. Plot the polarization data shown below for an electrode of 1.00cm2 of iron in an acid solution of pH=1 bubbled with pure hydrogen under activation polarization. How might the potentials in this data have been measured experimentally? The data collection began at ECor. From your plot, determine the rate of hydrogen reduction on the surface of the electrode. [3 pts] 6. Determine the anodic polarization curve from the cathodic data above [ 3pts
Step by Step Solution
There are 3 Steps involved in it
1 Expert Approved Answer
Step: 1 Unlock

Question Has Been Solved by an Expert!
Get step-by-step solutions from verified subject matter experts
Step: 2 Unlock
Step: 3 Unlock