

Question: Plot the polarization data shown below for an electrode of 1.00 cm of iron in an acid solution of pH=1 bubbled with pure hydrogen
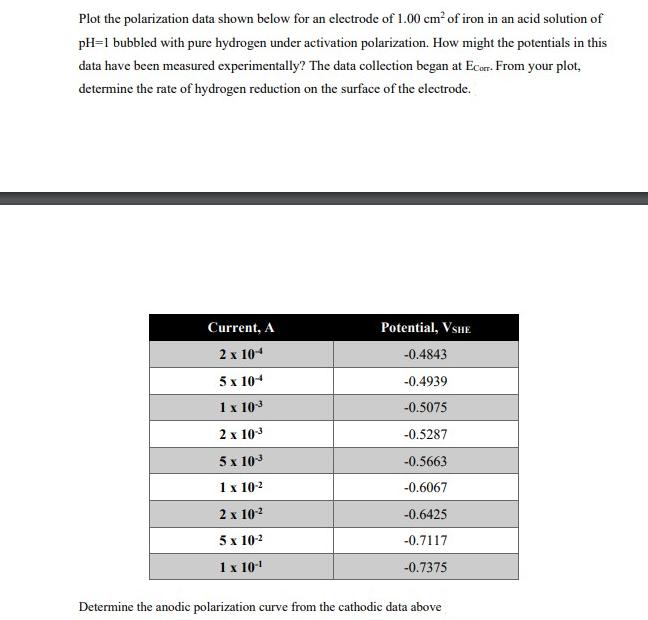
Plot the polarization data shown below for an electrode of 1.00 cm of iron in an acid solution of pH=1 bubbled with pure hydrogen under activation polarization. How might the potentials in this data have been measured experimentally? The data collection began at Ecorr. From your plot, determine the rate of hydrogen reduction on the surface of the electrode. Current, A 2 x 10⁴ 5 x 10⁴ 1 x 10- 2 x 10 5 x 10⁻³ 1 x 10- 2 x 10- 5 x 10- 1 x 10- Potential, VSHE -0.4843 -0.4939 -0.5075 -0.5287 -0.5663 -0.6067 -0.6425 -0.7117 -0.7375 Determine the anodic polarization curve from the cathodic data above
Step by Step Solution
3.49 Rating (159 Votes )
There are 3 Steps involved in it
Solutions Step 1 First we need to find out the logarithmic of current from the data given be... View full answer

Get step-by-step solutions from verified subject matter experts