

Question: 5. Plotting and Sub-Plotting 1) Plot the following functions in one figure, and add x-label, y-label, legend, title, and grid lines. x = 0.1,0.4,0.7.....1.9. 1
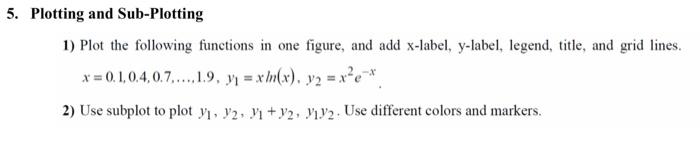
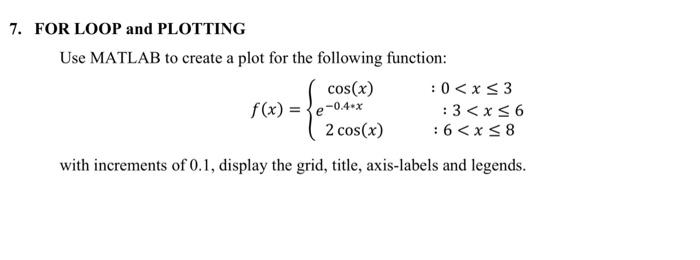
5. Plotting and Sub-Plotting 1) Plot the following functions in one figure, and add x-label, y-label, legend, title, and grid lines. x = 0.1,0.4,0.7.....1.9. 1 = x In(x). y2 = xe*. 2) Use subplot to ploty, y2, Y + y2, 172. Use different colors and markers. 7. FOR LOOP and PLOTTING Use MATLAB to create a plot for the following function: cos(x) : 0
Step by Step Solution
There are 3 Steps involved in it
1 Expert Approved Answer
Step: 1 Unlock

Question Has Been Solved by an Expert!
Get step-by-step solutions from verified subject matter experts
Step: 2 Unlock
Step: 3 Unlock