

Question: matlab help Problem 3 (plot commands: figure, plot, fplot, plotyy, subplot, grid, axis, xlabel, ylabel, legend, linewidth, markersize, :, --, k, b, r, *, +,
matlab help
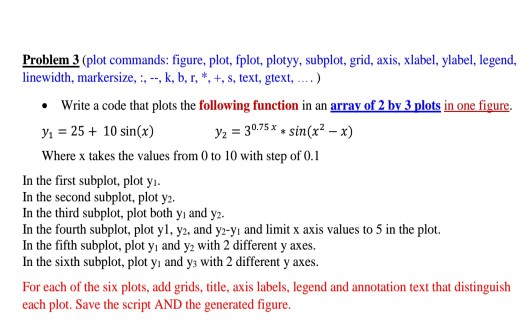
Problem 3 (plot commands: figure, plot, fplot, plotyy, subplot, grid, axis, xlabel, ylabel, legend, linewidth, markersize, :, --, k, b, r, *, +, s, text, gtext, . ) Write a code that plots the following function in an array of 2 by 3 plots in one figure. ??1 = 25 + 10 sin(??) ??2 = 3 0.75 ?? ? ??????(?? 2 ? ??) Where x takes the values from 0 to 10 with step of 0.1 In the first subplot, plot y1. In the second subplot, plot y2. In the third subplot, plot both y1 and y2. In the fourth subplot, plot y1, y2, and y2-y1 and limit x axis values to 5 in the plot. In the fifth subplot, plot y1 and y2 with 2 different y axes. In the sixth subplot, plot y1 and y3 with 2 different y axes. For each of the six plots, add grids, title, axis labels, legend and annotation text that distinguish each plot. Save the script AND the generated figure.
matlab code please
Problem 3 (plot commands: figure, plot, fplot, plotyy, subplot, grid, axis, xlabel, ylabel, legend linewidth, markersize,: --, k, b, r, *, +, s, text, gtext,. Write a code that plots the following function in an arrav of 2 by 3 plots in one figure. Y2 = 30.75 x * sin (x2-x) y, = 25 + 10 sin(x) Where x takes the values from 0 to 10 with step of 0.1 In the first subplot, plot yi In the second subplot, plot y2 In the third subplot, plot both yi and y2. In the fifth subplot, plot y and y2 with 2 different y axes. In the sixth subplot, plot yi and ys with 2 different y axes For each of the six plots, add grids, title, axis labels, legend and annotation text that distinguish each plot. Save the script AND the generated figure
Step by Step Solution
There are 3 Steps involved in it

Get step-by-step solutions from verified subject matter experts