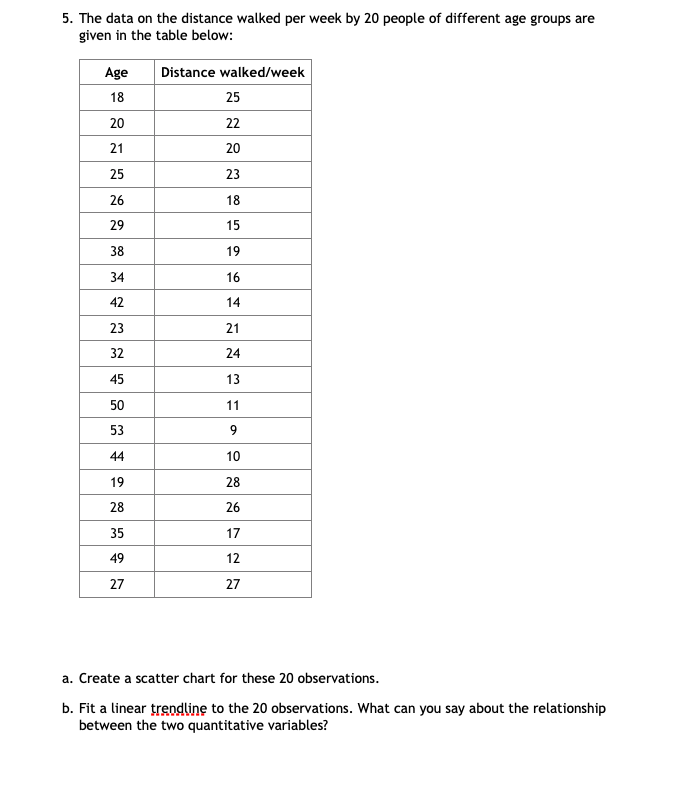
Question: 5. The data on the distance walked per week by 20 people of different age groups are given in the table below: Age 18 Distance

5. The data on the distance walked per week by 20

5. The data on the distance walked per week by 20 people of different age groups are given in the table below: Age 18 Distance walked/week 25 22 R 12 27 a. Create a scatter chart for these 20 observations. b. Fit a linear trendline to the 20 observations. What can you say about the relationship between the two quantitative variables

Step by Step Solution

There are 3 Steps involved in it

1 Expert Approved Answer
Step: 1 Unlock blur-text-image
Question Has Been Solved by an Expert!

Get step-by-step solutions from verified subject matter experts

Step: 2 Unlock
Step: 3 Unlock

Students Have Also Explored These Related General Management Questions!