

Question: The data on the distance walked per week by 20 people of different age groups are given in the table below. Age Distance Walked/Week 18

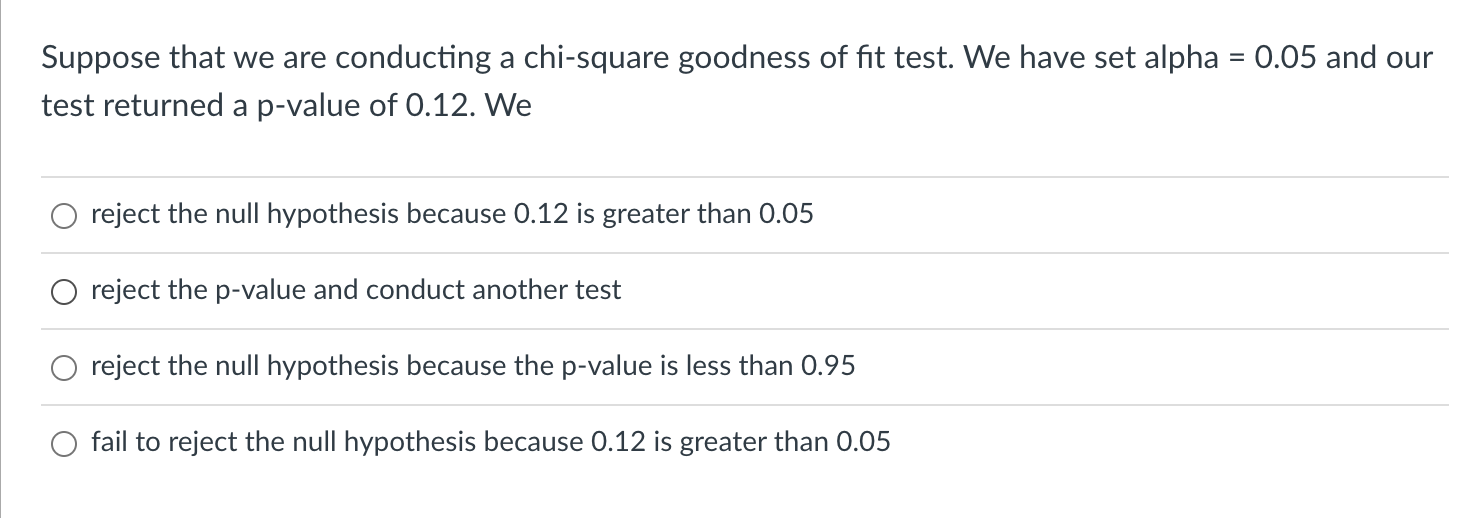
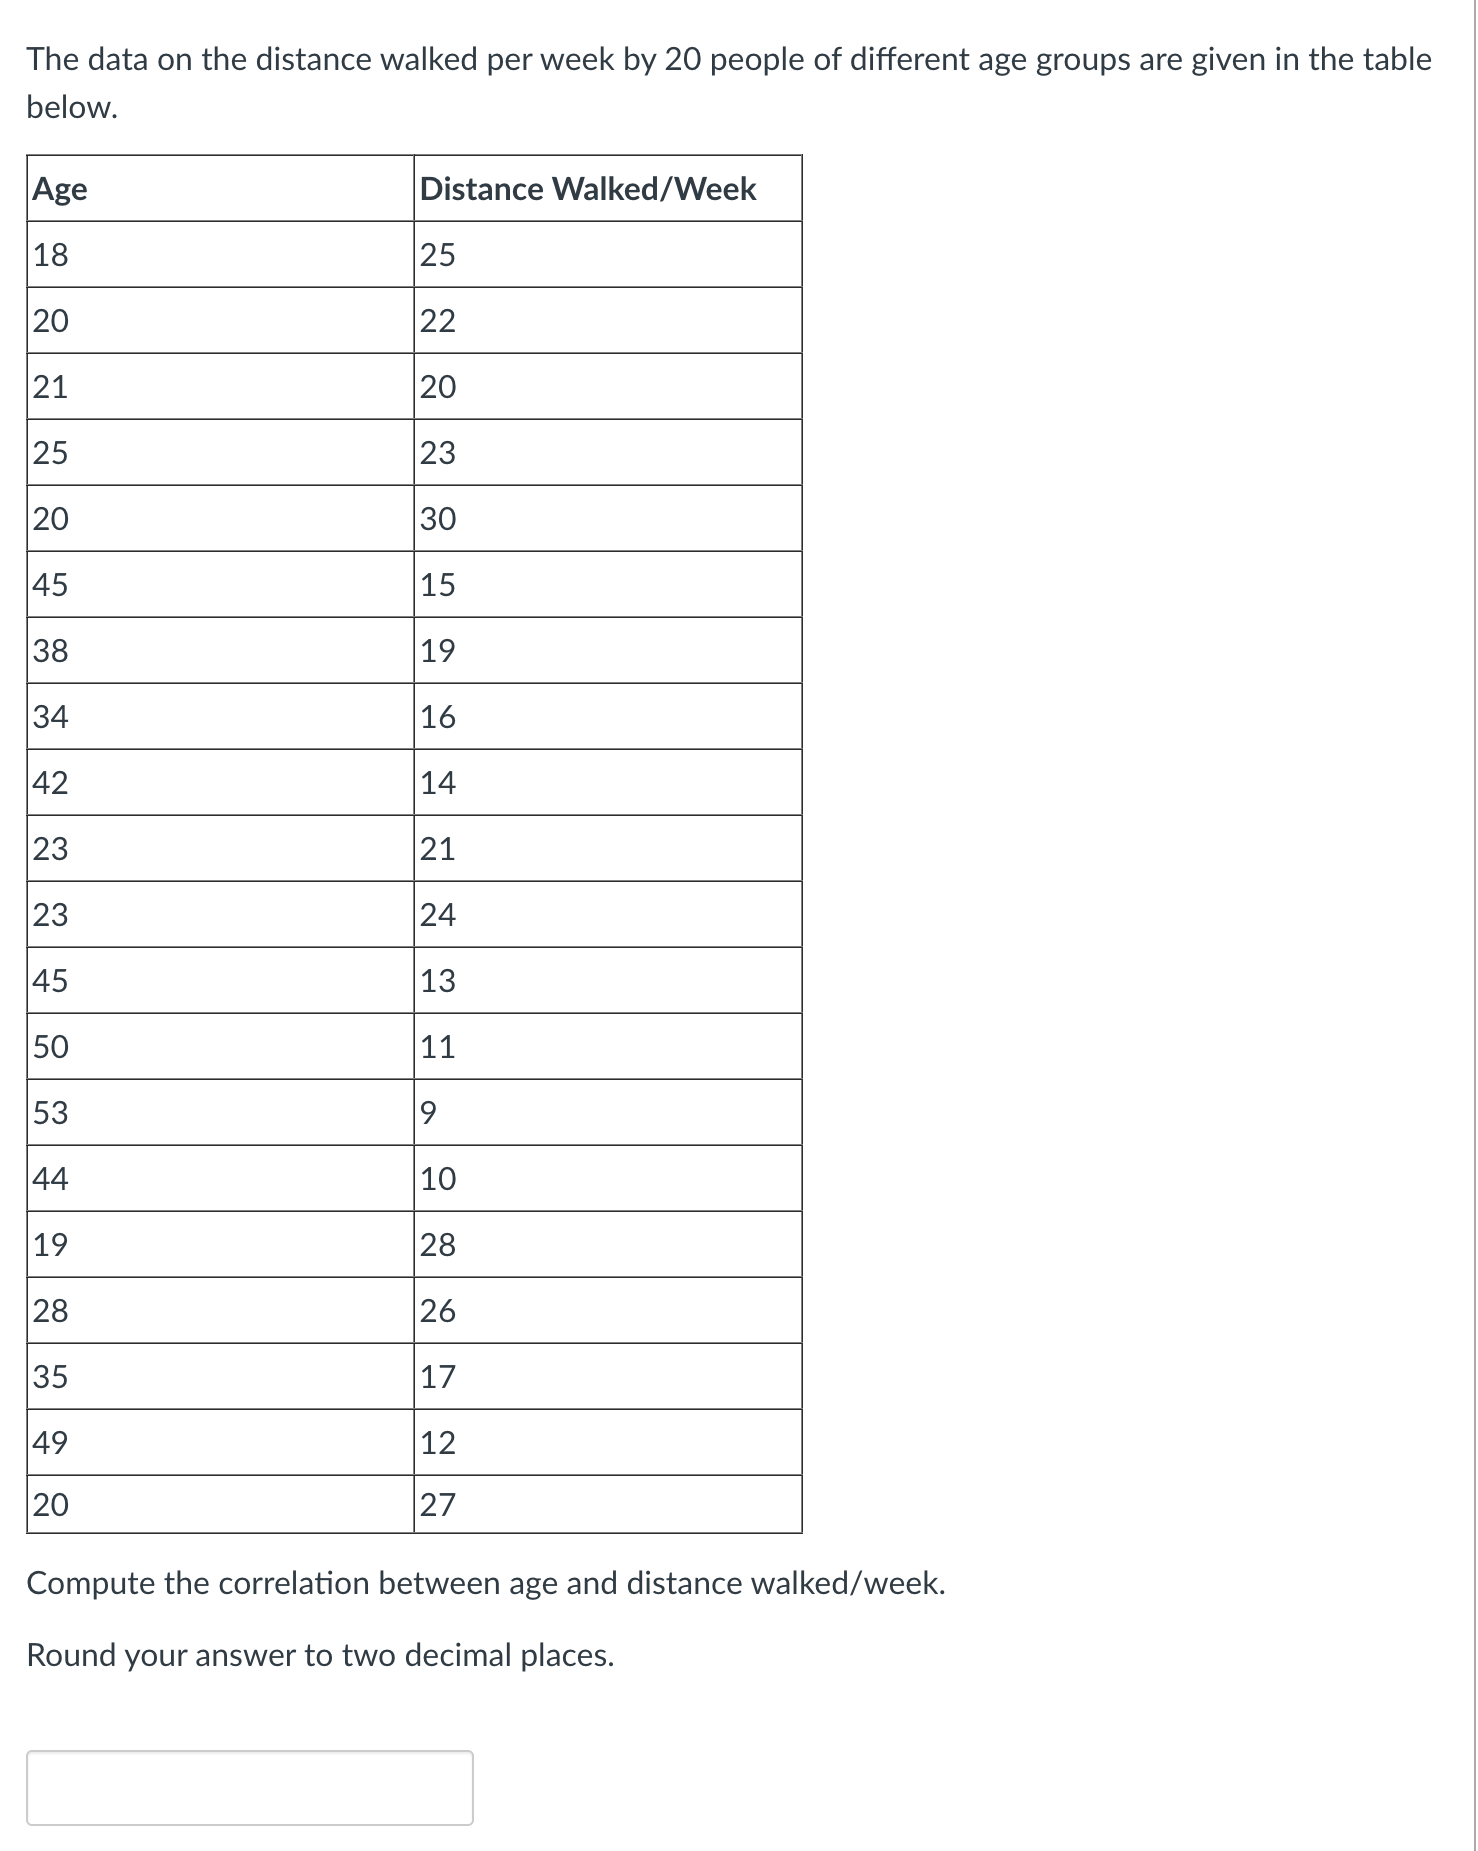

The data on the distance walked per week by 20 people of different age groups are given in the table below. Age Distance Walked/Week 18 25 20 22 21 20 25 23 20 30 45 15 38 19 34 16 42 14 23 21 23 24 45 13 50 11 53 9 44 10 19 28 28 26 35 17 49 12 20 27 Compute the correlation between age and distance walked/week. Round your answer to two decimal places.Suppose that we are conducting a chi-square goodness of t test. We have set alpha = 0.05 and our test returned a p-value of 0.12. We 0 reject the null hypothesis because 0.12 is greater than 0.05 O reject the p-value and conduct another test 0 reject the null hypothesis because the p-value is less than 0.95 O fail to reject the null hypothesis because 0.12 is greater than 0.05
Step by Step Solution
There are 3 Steps involved in it

Get step-by-step solutions from verified subject matter experts