

Question: ### 5 The following code makes a graph of the cumulative distribution function for the binomial distribution, that is $F(x) = prob(X le x)$
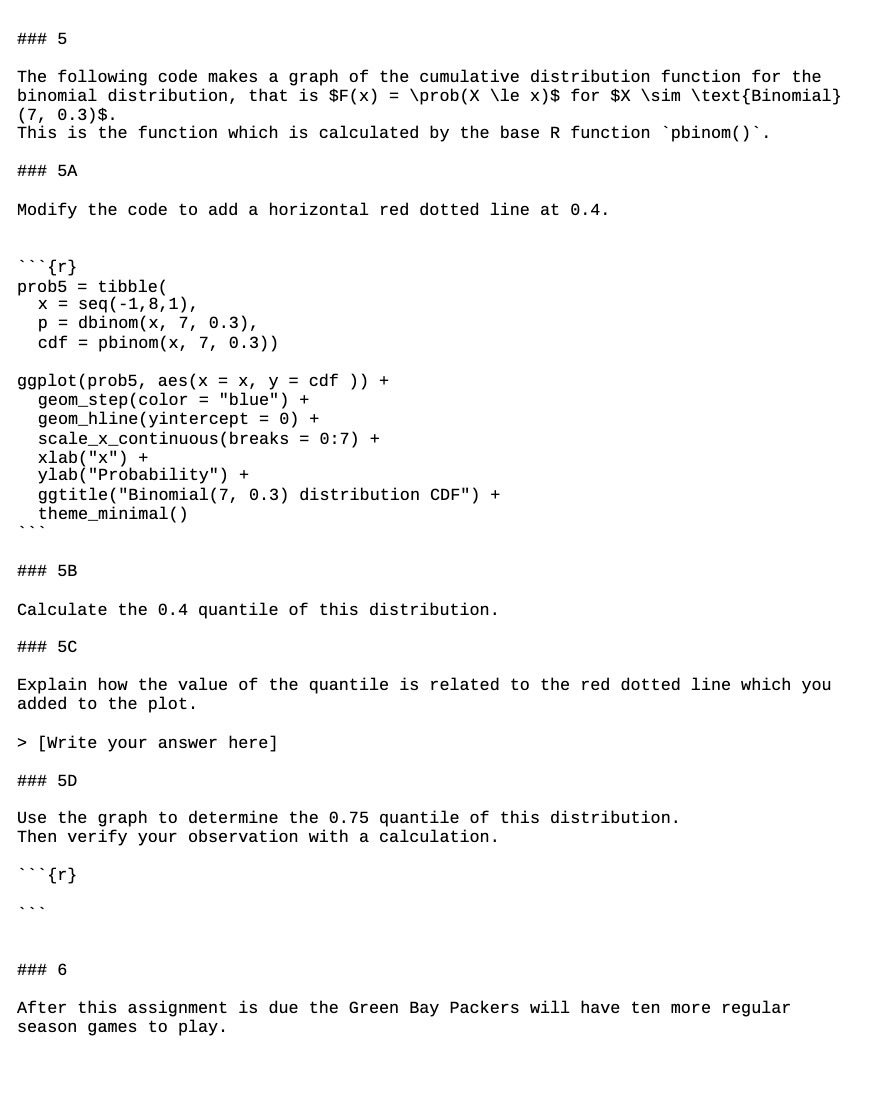
### 5 The following code makes a graph of the cumulative distribution function for the binomial distribution, that is $F(x) = \prob(X \le x)$ for $X \sim \text {Binomial} (7, 0.3)$. This is the function which is calculated by the base R function `pbinom ( )`. ### 5A Modify the code to add a horizontal red dotted line at 0.4. (r) prob5 tibble( x = seq(-1,8,1), p = dbinom(x, 7, 0.3), cdf pbinom(x, 7, 0.3)) ggplot (prob5, aes(x = x, y = cdf )) + = geom_step(color "blue") + geom_hline (yintercept = 0) + scale_x_continuous (breaks = 0:7) + xlab ("x") + ylab("Probability") + ggtitle("Binomial (7, 0.3) distribution CDF") + theme minimal() ### 5B Calculate the 0.4 quantile of this distribution. #HH SC Explain how the value of the quantile is related to the red dotted line which you added to the plot. >[Write your answer here] ### 5D Use the graph to determine the 0.75 quantile of this distribution. Then verify your observation with a calculation. {r} ### 6 After this assignment is due the Green Bay Packers will have ten more regular season games to play.
Step by Step Solution
There are 3 Steps involved in it

Get step-by-step solutions from verified subject matter experts