

Question: 5 The following data represent the time between eruptions and the length of Time, x Length, y Time, X Length, y eruption for 8 randomly
5
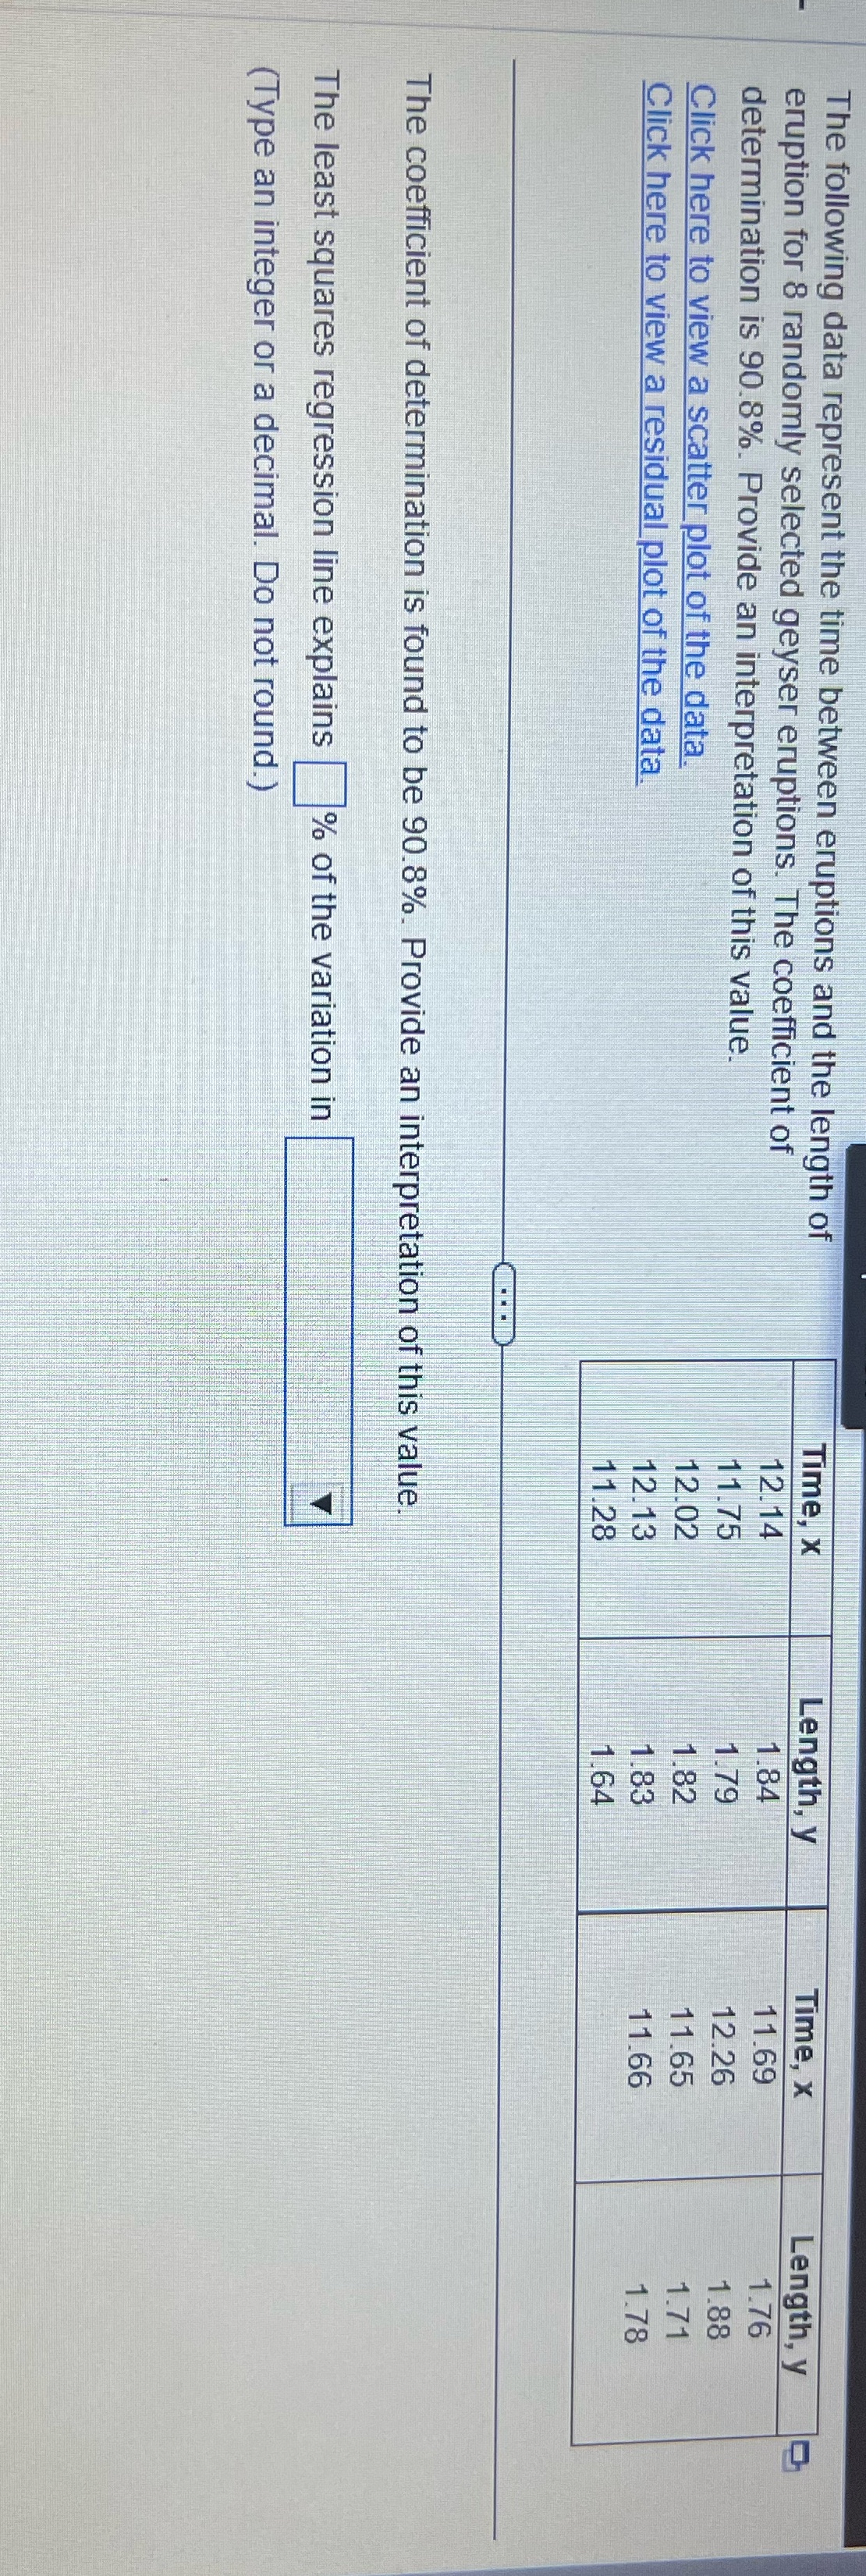
The following data represent the time between eruptions and the length of Time, x Length, y Time, X Length, y eruption for 8 randomly selected geyser eruptions. The coefficient of 12.14 1.84 11.69 1.76 determination is 90.8%. Provide an interpretation of this value 11.75 1.79 12.26 1.88 Click here to view a scatter plot of the data. 12.02 1.82 11.65 1.71 Click here to view a residual plot of the data. 12.13 1.83 11.66 1.78 11.28 1.64 The coefficient of determination is found to be 90.8%. Provide an interpretation of this value The least squares regression line explains | % of the variation in (Type an integer or a decimal. Do not round.)
Step by Step Solution
There are 3 Steps involved in it
1 Expert Approved Answer
Step: 1 Unlock

Question Has Been Solved by an Expert!
Get step-by-step solutions from verified subject matter experts
Step: 2 Unlock
Step: 3 Unlock