

Question: The following data represent the time between eruptions and the length of eruption for 8 randomly selected geyser eruptions. Scatter plot of eruption data. X
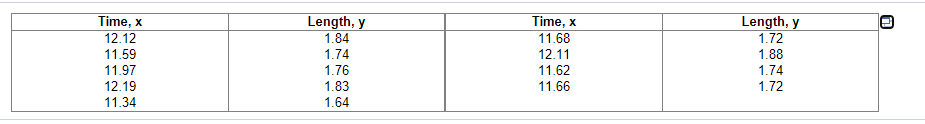
The following data represent the time between eruptions and the length of eruption for 8 randomly selected geyser eruptions.
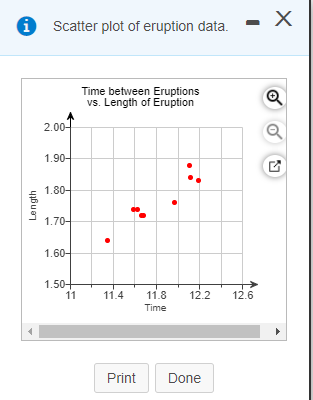
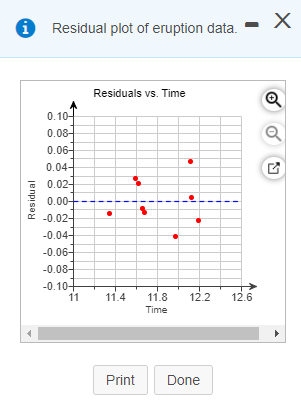
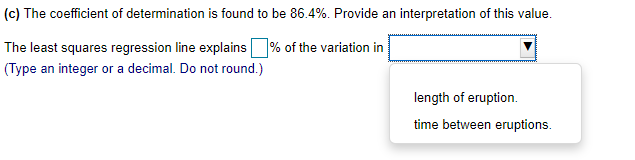
Scatter plot of eruption data. X Time between Eruptions vs. Length of Eruption 2.00- 1.90- 1.80- Length 1.70- 1.60- 1.50 11 11.4 11.8 12.2 12.6 Time Print DoneH Residual plot of eruption data. X Residuals vs. Time 0. 10-J 0.08- 0.06- 0.04- 0.02- Residual 0.00- -0.02- -0.04- -0.06- -0.08- -0.10+ 11 11.4 11.8 12.2 12.6 Time Print Done(c) The coefficient of determination is found to be 86.4%. Provide an interpretation of this value. The least squares regression line explains % of the variation in (Type an integer or a decimal. Do not round.) length of eruption. time between eruptions.\f
Step by Step Solution
There are 3 Steps involved in it

Get step-by-step solutions from verified subject matter experts