

Question: please help The following data represent the time between eruptions and the length of eruption for 8 randomly selected geyser eruptions. Complete parts (a) through
please help
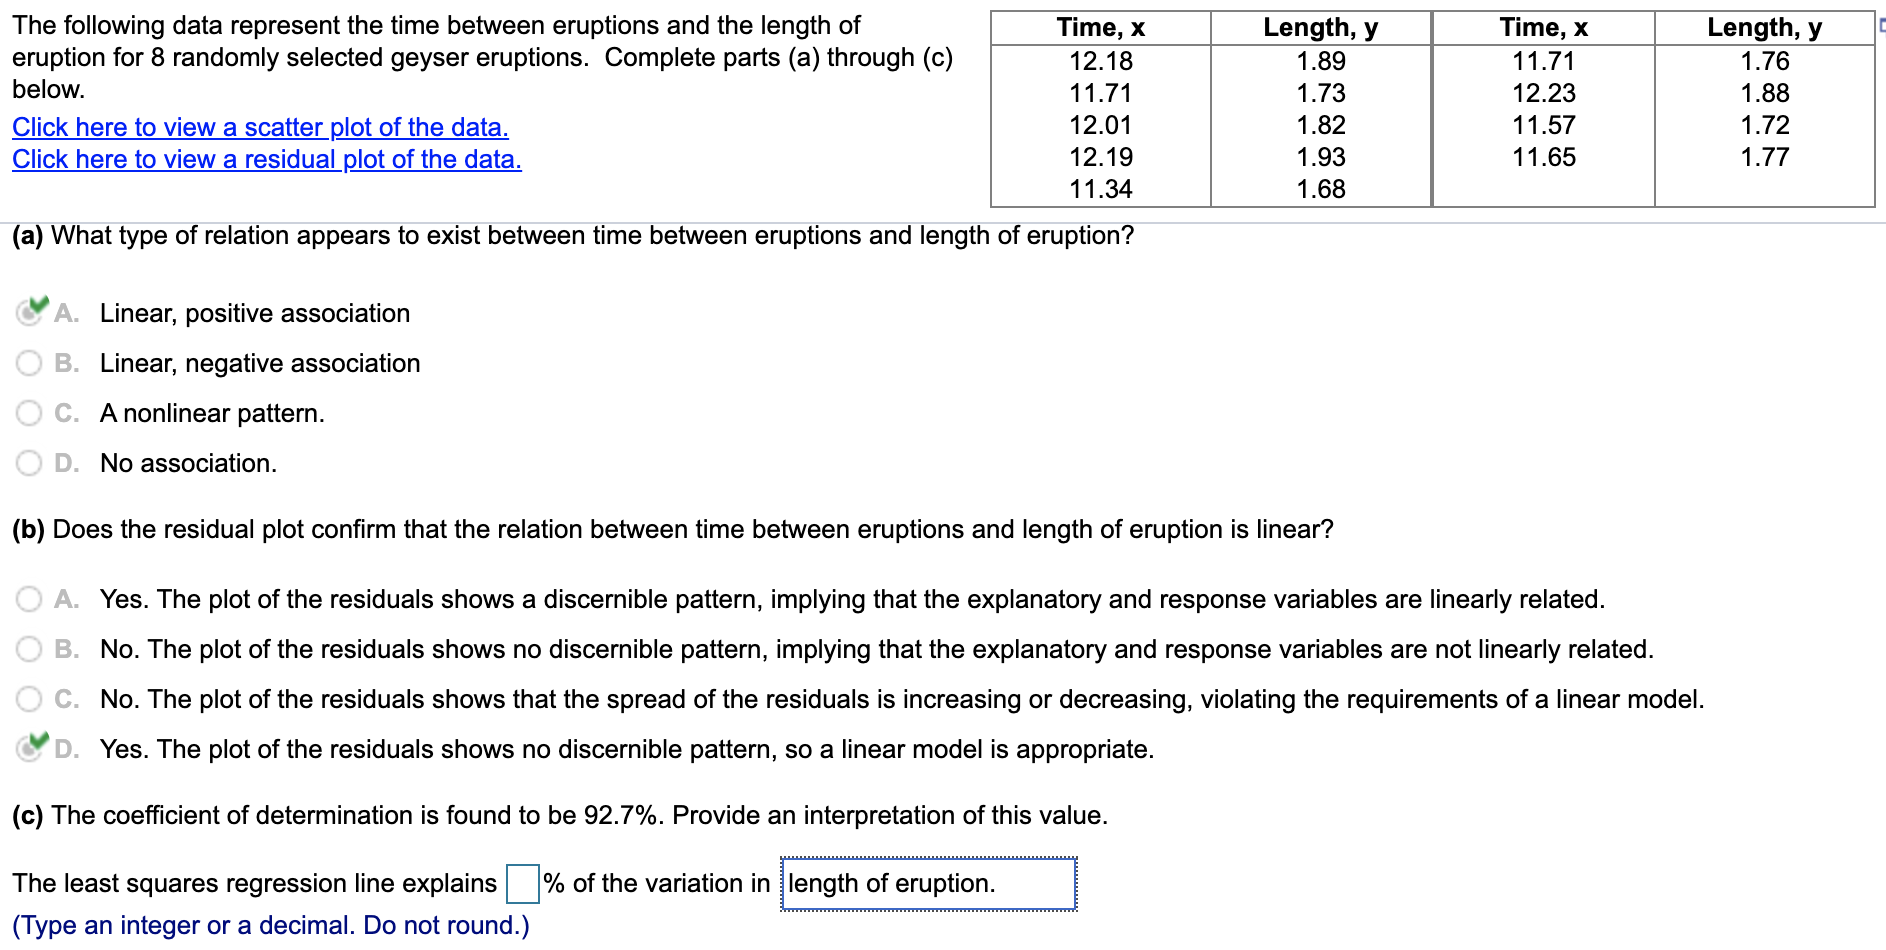
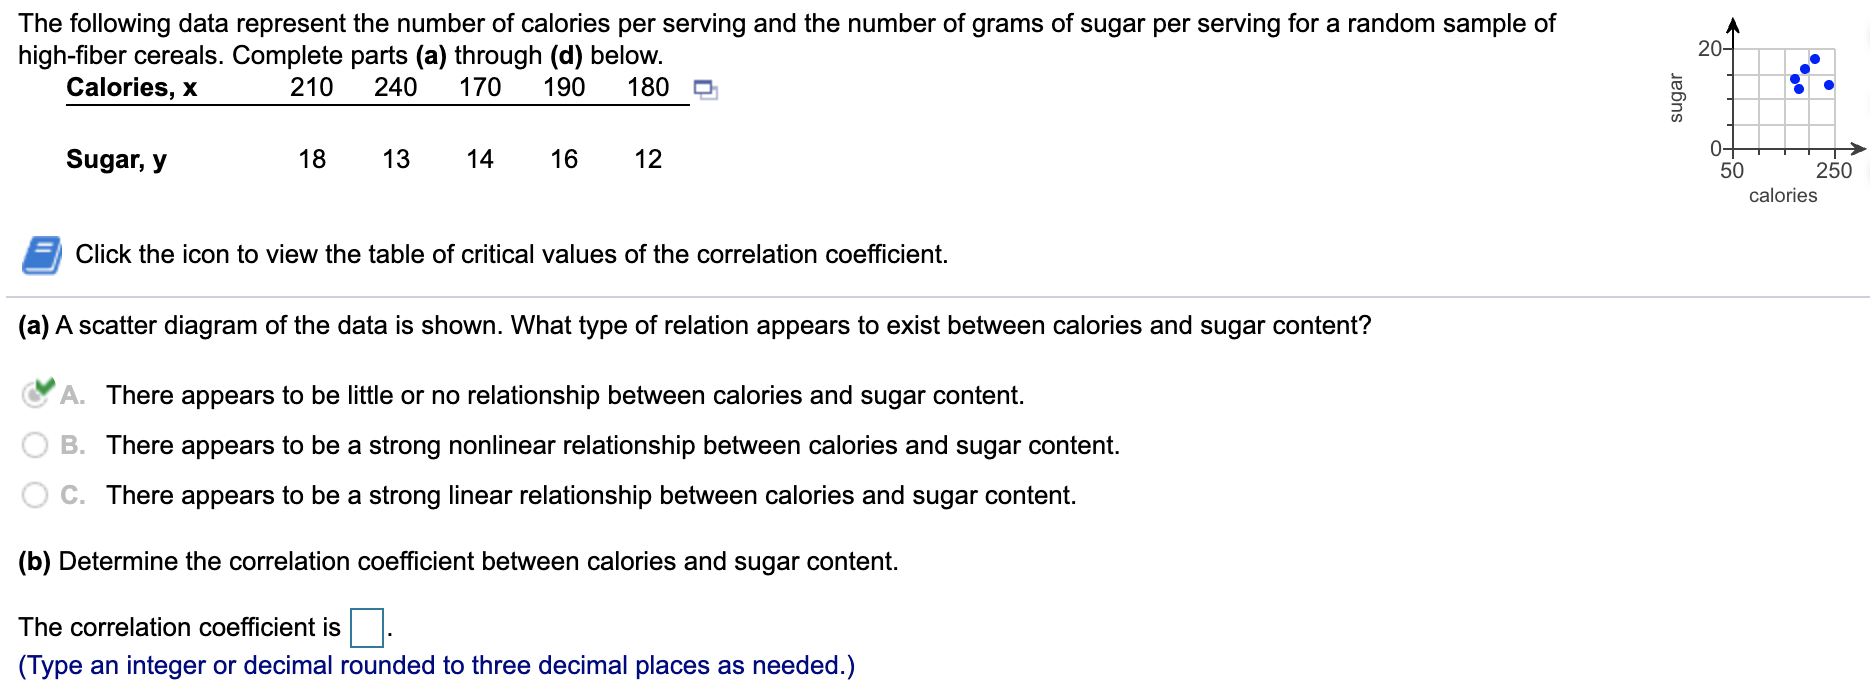
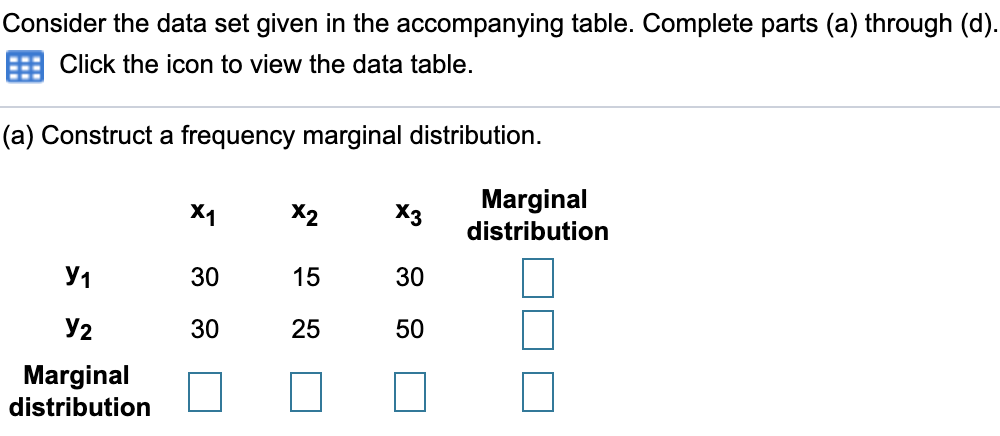
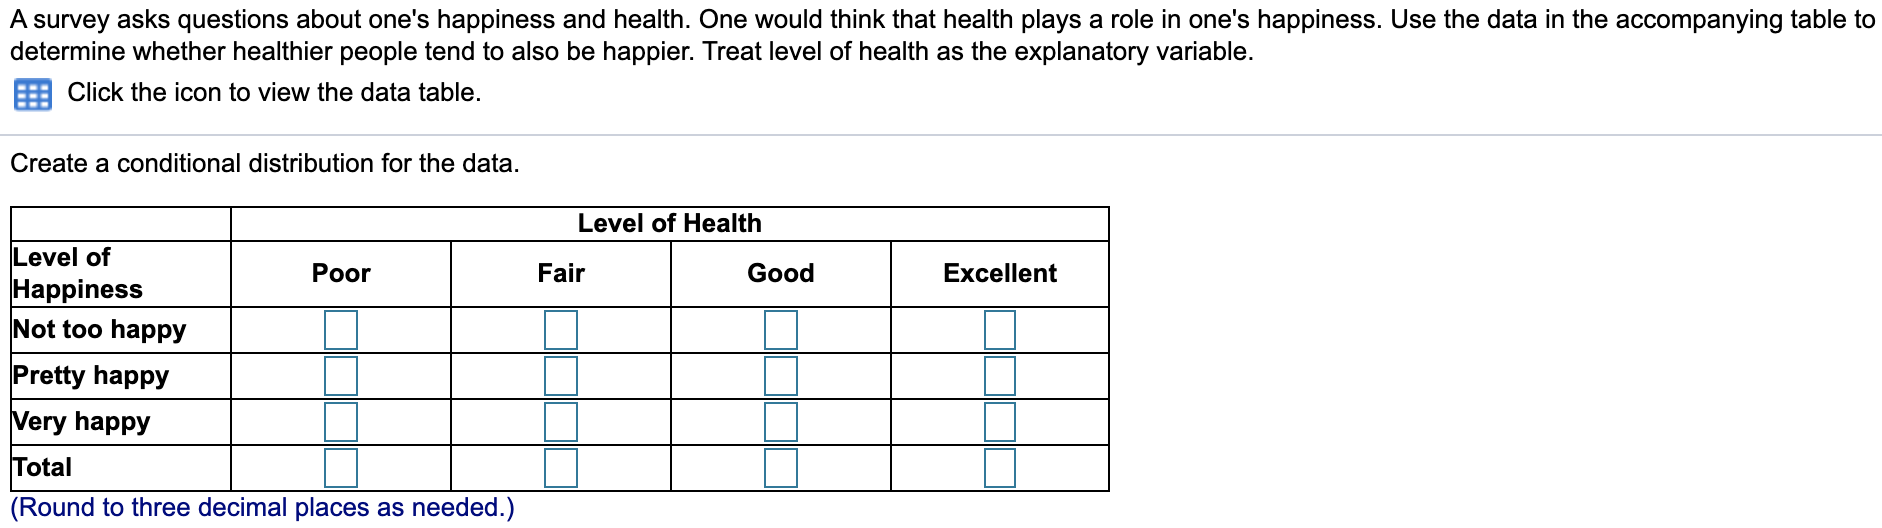
The following data represent the time between eruptions and the length of eruption for 8 randomly selected geyser eruptions. Complete parts (a) through (c) below. Click here to view a scatter plot of the data. Click here to view a residual plot of the data. (a) What type of relation appears to exist between time between eruptions and length of eruption? s" A. Linear, positive association B. Linear, negative association C. A nonlinear pattern. D. No association. (b) Does the residual plot conrm that the relation between time between eruptions and length of eruption is linear? A. Yes. The plot of the residuals shows a discernible pattern, implying that the explanatory and response variables are linearly related. B. No. The plot of the residuals shows no discernible pattern, implying that the explanatory and response variables are not linearly related. C. No. The plot of the residuals shows that the spread of the residuals is increasing or decreasing, violating the requirements of a linear model. 3' D. Yes. The plot of the residuals shows no discernible pattern, so a linear model is appropriate. (c) The coefcient of determination is found to be 92.7%. Provide an interpretation of this value. The least squares regression line explains |:|% of the variation in length of eruption. (Type an integer or a decimal. Do not round.) The following data represent the number of calories per serving and the number of grams of sugar per serving for a random sample of high-fiber cereals. Complete parts (a) through (d) below. 20- Calories, x 210 240 170 190 180 sugar Sugar, y 18 13 14 16 12 0- 50 250 calories Click the icon to view the table of critical values of the correlation coefficient. (a) A scatter diagram of the data is shown. What type of relation appears to exist between calories and sugar content? A. There appears to be little or no relationship between calories and sugar content. O B. There appears to be a strong nonlinear relationship between calories and sugar content. O C. There appears to be a strong linear relationship between calories and sugar content. (b) Determine the correlation coefficient between calories and sugar content. The correlation coefficient is (Type an integer or decimal rounded to three decimal places as needed.)Consider the data set given in the accompanying table. Complete parts (a) through (d) Click the icon to view the data table. (a) Construct a frequency marginal distribution. X1 X2 X3 Marginal distribution y1 30 15 30 2 30 25 50 Marginal distributionAsurvey asks questions about one's happiness and health. One would think that health plays a role in one's happiness. Use the data in the accompanying table to determine whether healthier people tend to also be happier. Treat level of health as the explanatory variable. Click the icon to view the data table. Create a conditional distribution for the data. Level of Health Level of Happiness Not too happy Pretty happy Very happy Total (Round to three decimal places as needed.) Poor Fair Good Excellent
Step by Step Solution
There are 3 Steps involved in it

Get step-by-step solutions from verified subject matter experts