

Question: 5. The relationship between marginal and average costs Consider the following scenario to understand the relationship between marginal and average values. Suppose Clancy is a


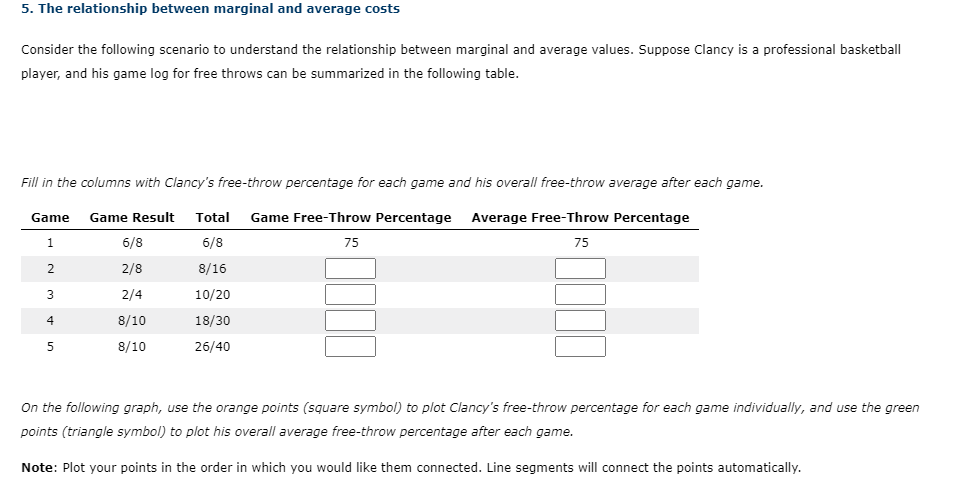
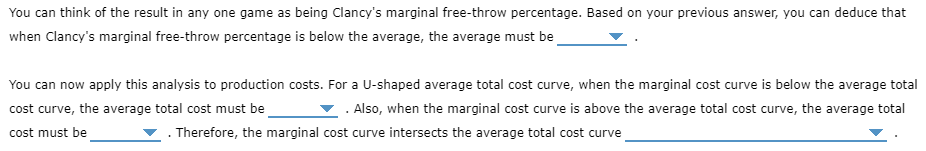
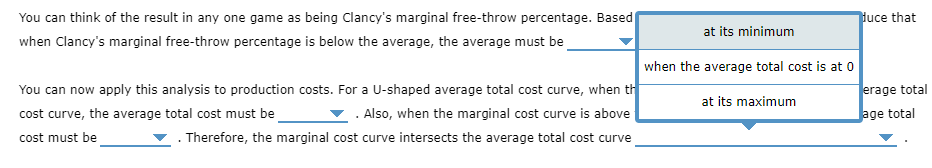
5. The relationship between marginal and average costs Consider the following scenario to understand the relationship between marginal and average values. Suppose Clancy is a professional basketball player, and his game log for free throws can be summarized in the following table. Fill in the columns with Clancy's freethrow percentage for each game and his overall freethrow average after each game. Game Game Result Tolal Game FreeFThrow Percentage Average Free~Throw Percentage 1 are are as 75 2 2m 3315 E E 3 2:4 lnrzo E E 4 3m) 13r30 E E 5 arm 26440 E E On the following graph, use the orange points (square symbol) to pint Clancy's freethrow percentage for each game individually. and use the green points (triangle symbol) to plot his overali average freethrow percentage after each game. Note: Plot your points in the order in which you would like them connected. Line segments will connect the points automatically. You can think of the result in an'lur one game as being Clancy's marginal freethrow percentage. Based on your previous answer, vou can deduce that when Clancy's marginal freethrowI percentage is below the average, the average must be v . You can now appli,r this analvsis to production costs. For a Ushaped average total cost curve, when the marginal cost curve is below the average total cost curve, the average total cost must be V . Also, when the marginal cost curve is above the average total cost curve, the average total cost must be V . Therefore, the marginal cost curve intersects the average total cost curve V . You can think of the result in anlur one game as being Clancy's marginal Free-throwI percentage. Based IUCB that when Clancy's marginal freethrow percentage is below the average, the average must be v when the average total cost is at I) You can now apply' this analysis to production costs. For a Ushaped average total cost curve, when I . _ -rage total _ _ at Its maxrmum cost curve, the average total cost must be V . Also, when the marglnal cost curve Is above -ge total cost must be v . Therefore, the marginal cost curve intersects the average total cost curve 7
Step by Step Solution
There are 3 Steps involved in it

Get step-by-step solutions from verified subject matter experts