

Question: pleasw plot game free throw percentage and average free throw percentage curves! also, all of the bland but the last on are an option between
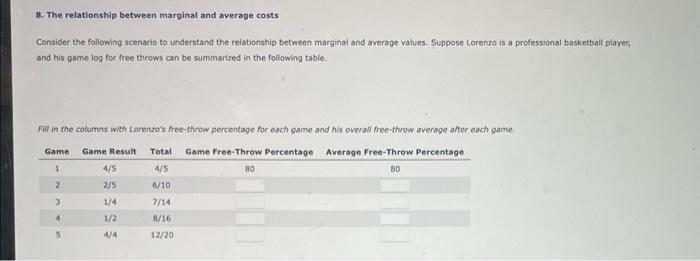
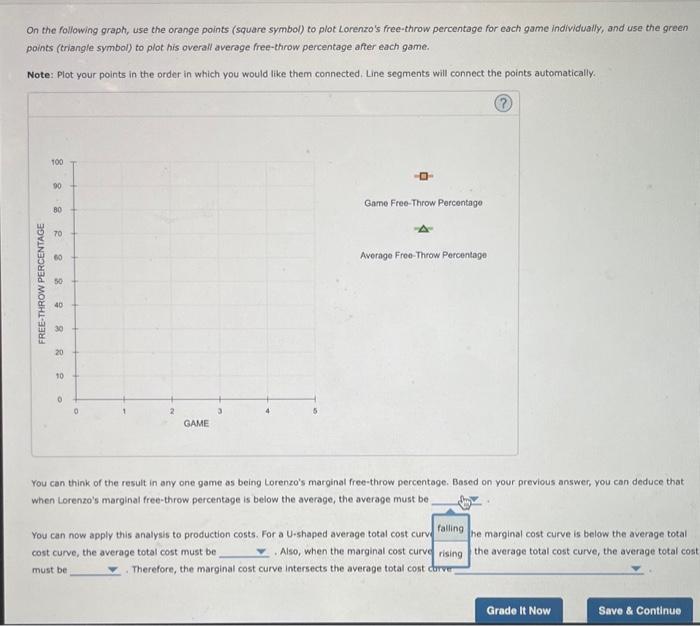
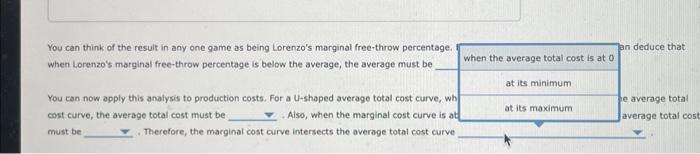
8. The relationship between marginal and average costs Consider the following scenario to understand the relationship between marginal and average values. Suppose Lorenzo is a professional basketball player, and his game log for free throws can be summarized in the following table. Fin in the columns with Lorento's free-throw percentage for each game and his overall frec-throw average after each game. On the following graph, use the orange points (square symbol) to plot Lorenzo's free-throw percentage for cach game individually, and use the green points (triangle symbol) to plot his overall average free-throw percentage after each game. Note: Plot your points in the order in which you would like them connected, Line segments will connect the points automatically. You can think of the result in any one game as being Lorenzo's marginal free-throw percentage. Based on your previous answer, you can deduce that when Lorenzo's marginal free-throw percentage is below the average, the average must be You can now apply this analysis to production costs. For a U-shaped average total cost curv he marginal cost curve is below the average total cost curve, the average total cost must be . Aso, when the marginal cost curve the average total cost curve, the average total cost must be Therefore, the marginal cost curve intersects the average total cost You can think of the result in any one game as being Lorenzo's marginal free-throw percentage. I an deduce that when Lorenzo's marginal free-throw percentage is below the average, the average must be You can now apply this analysis to production costs. For a U-shaped average total cost curve, wh ie average total cost curve, the average total cost must be Also, when the marginal cost curve is at must be . Therefore, the marginal cost curve intersects the average total cost curve
Step by Step Solution
There are 3 Steps involved in it

Get step-by-step solutions from verified subject matter experts