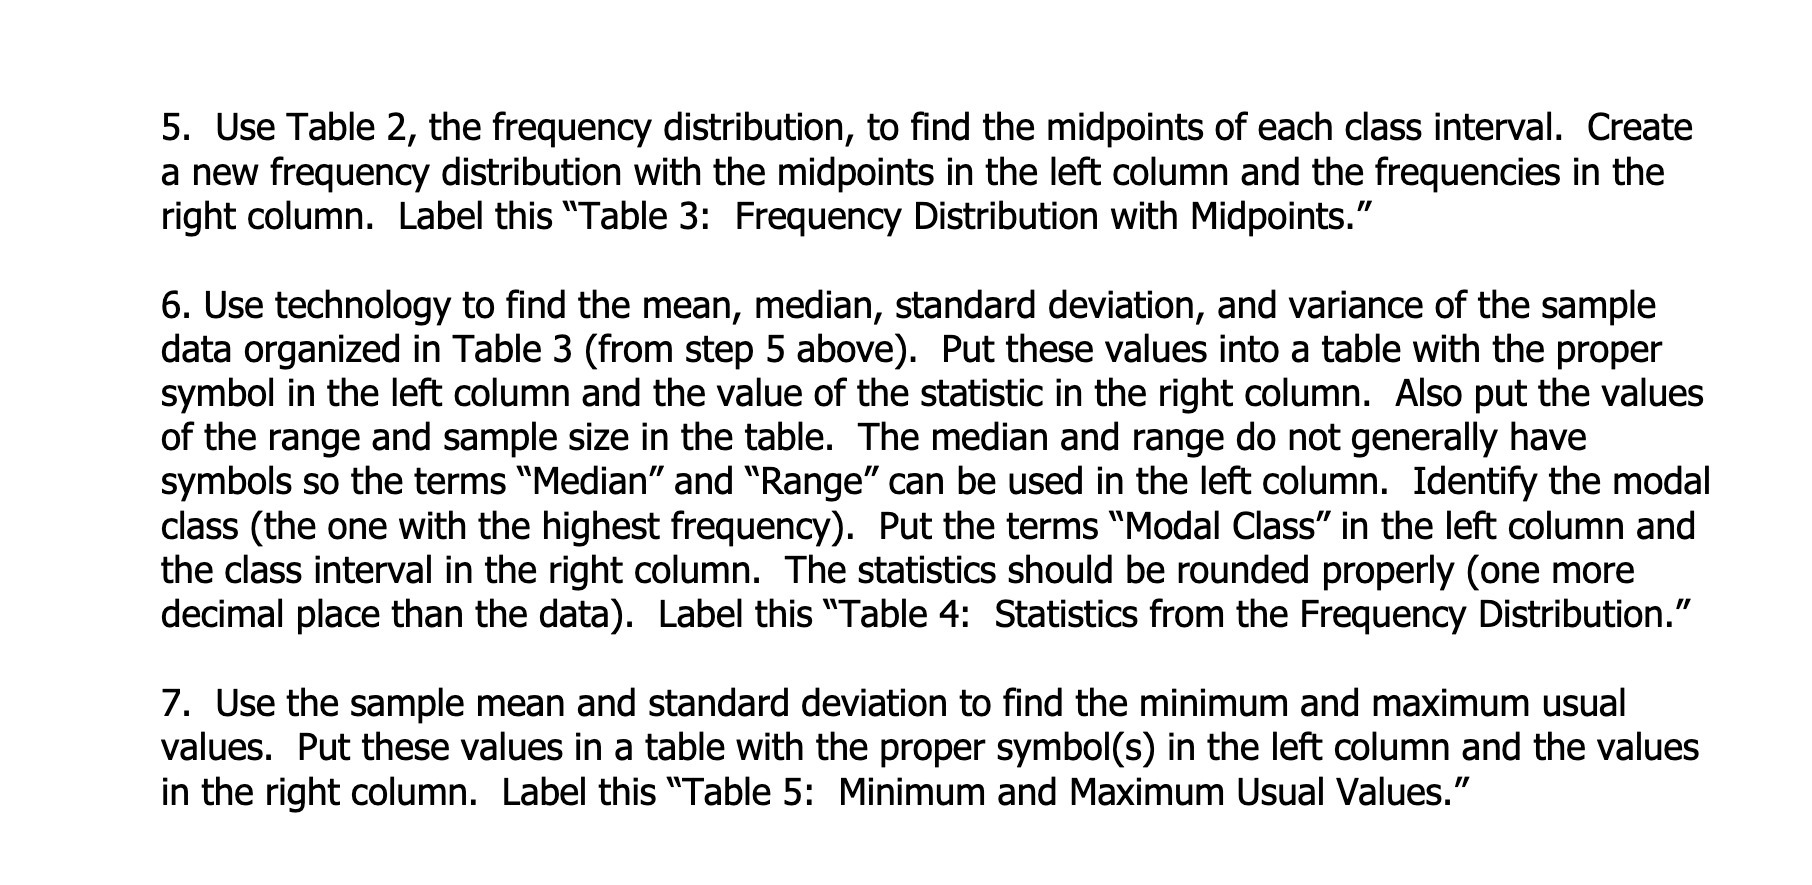
Question: 5. Use Table 2, the frequency distribution, to nd the midpoints of each class interval. Create a new frequency distribution with the midpoints in the

5. Use Table 2, the frequency distribution, to nd
5. Use Table 2, the frequency distribution, to nd the midpoints of each class interval. Create a new frequency distribution with the midpoints in the left column and the frequencies in the right column. Label this \"Table 3: Frequency Distribution with Midpoints.\" 6. Use technology to nd the mean, median, standard deviation, and variance of the sample data organized in Table 3 (from step 5 above). Put these values into a table with the proper symbol in the left column and the value of the statistic in the right column. Also put the values of the range and sample size in the table. The median and range do not generally have symbols so the terms \"Median\" and \"Range\" can be used in the left column. Identify the modal class (the one with the highest frequency). Put the terms \"Modal Class\" in the left column and the class interval in the right column. The statistics should be rounded properly (one more decimal place than the data). Label this \"Table 4: Statistics from the Frequency Distribution.\" 7. Use the sample mean and standard deviation to nd the minimum and maximum usual values. Put these values in a table with the proper symbo|(s) in the left column and the values in the right column. Label this \"Table 5: Minimum and Maximum Usual Values."

Step by Step Solution

There are 3 Steps involved in it

1 Expert Approved Answer
Step: 1 Unlock blur-text-image
Question Has Been Solved by an Expert!

Get step-by-step solutions from verified subject matter experts

Step: 2 Unlock
Step: 3 Unlock

Students Have Also Explored These Related Mathematics Questions!