

Question: 5. Use the plot cmd to plot the function f(x)=0.7(x+1)x2+3x+32 The function has an asymptote. To avoid that, plot use linspace to create 2 separate
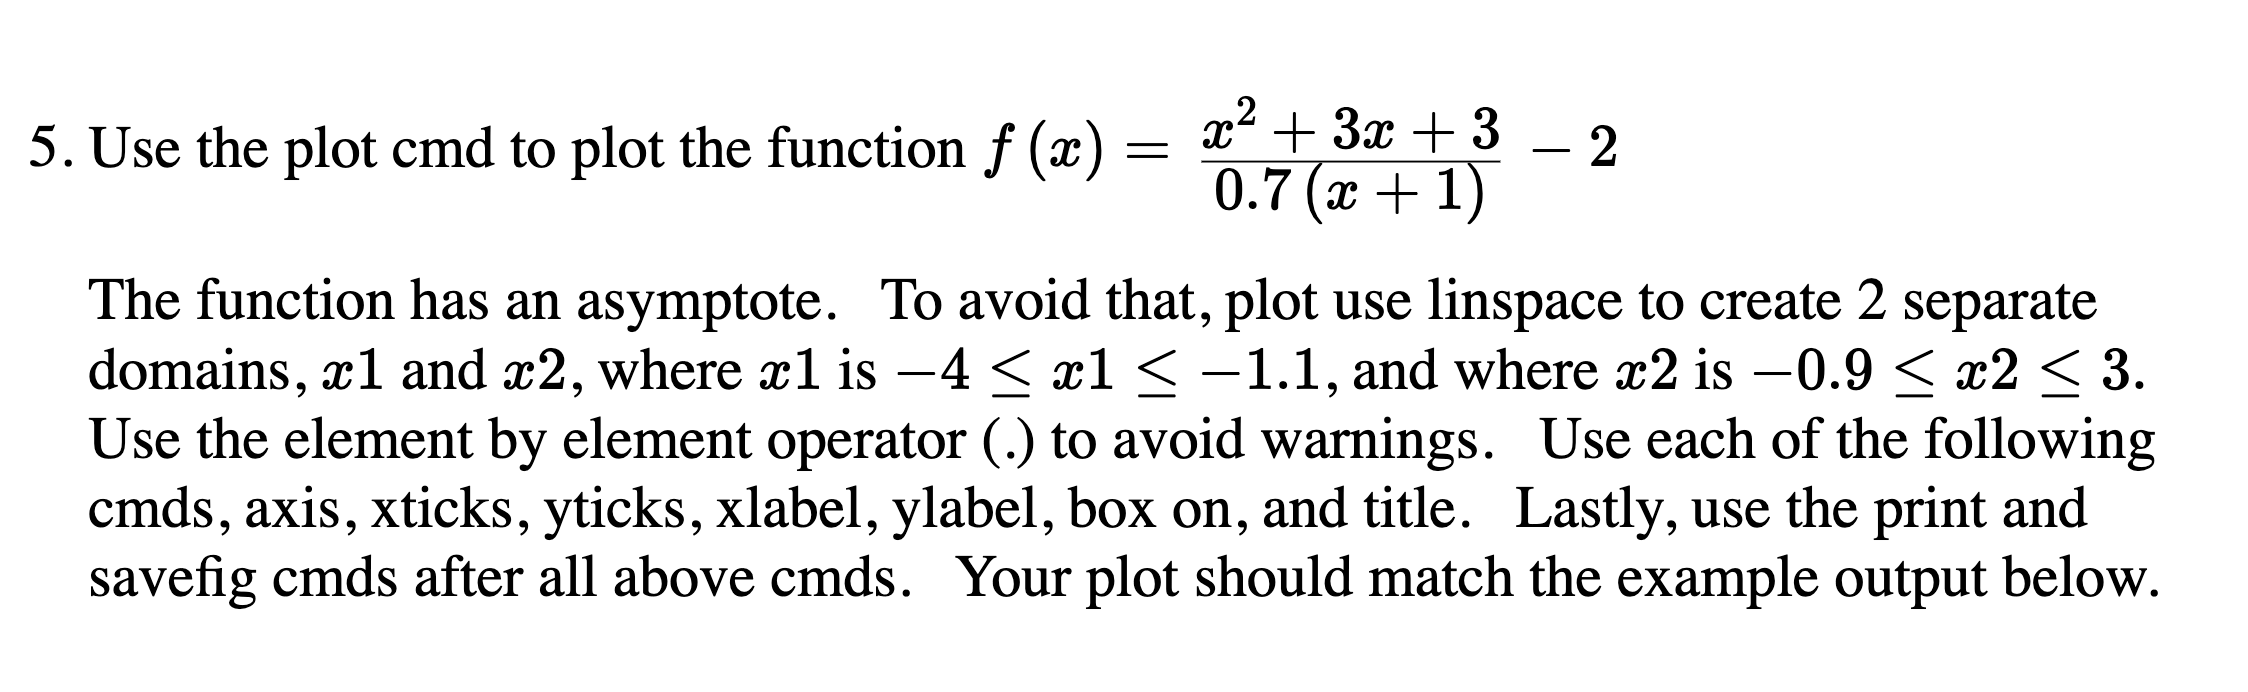
5. Use the plot cmd to plot the function f(x)=0.7(x+1)x2+3x+32 The function has an asymptote. To avoid that, plot use linspace to create 2 separate domains, x1 and x2, where x1 is 4x11.1, and where x2 is 0.9x23. Use the element by element operator (.) to avoid warnings. Use each of the following cmds, axis, xticks, yticks, xlabel, ylabel, box on, and title. Lastly, use the print and savefig cmds after all above cmds. Your plot should match the example output below
Step by Step Solution
There are 3 Steps involved in it
1 Expert Approved Answer
Step: 1 Unlock

Question Has Been Solved by an Expert!
Get step-by-step solutions from verified subject matter experts
Step: 2 Unlock
Step: 3 Unlock