

Question: 5. What are two conclusions you can draw from the data in the table and the graph? In making your conclusion, cite specific data to
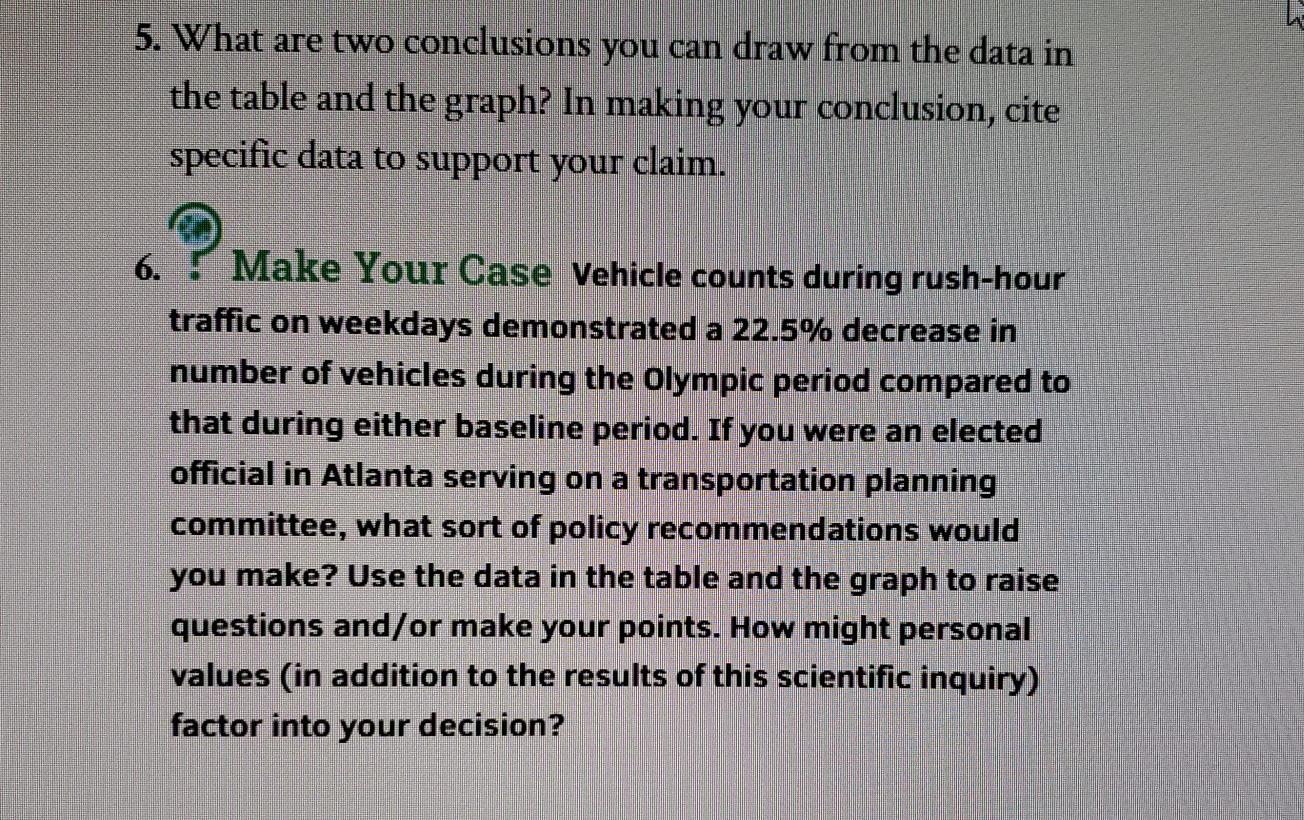
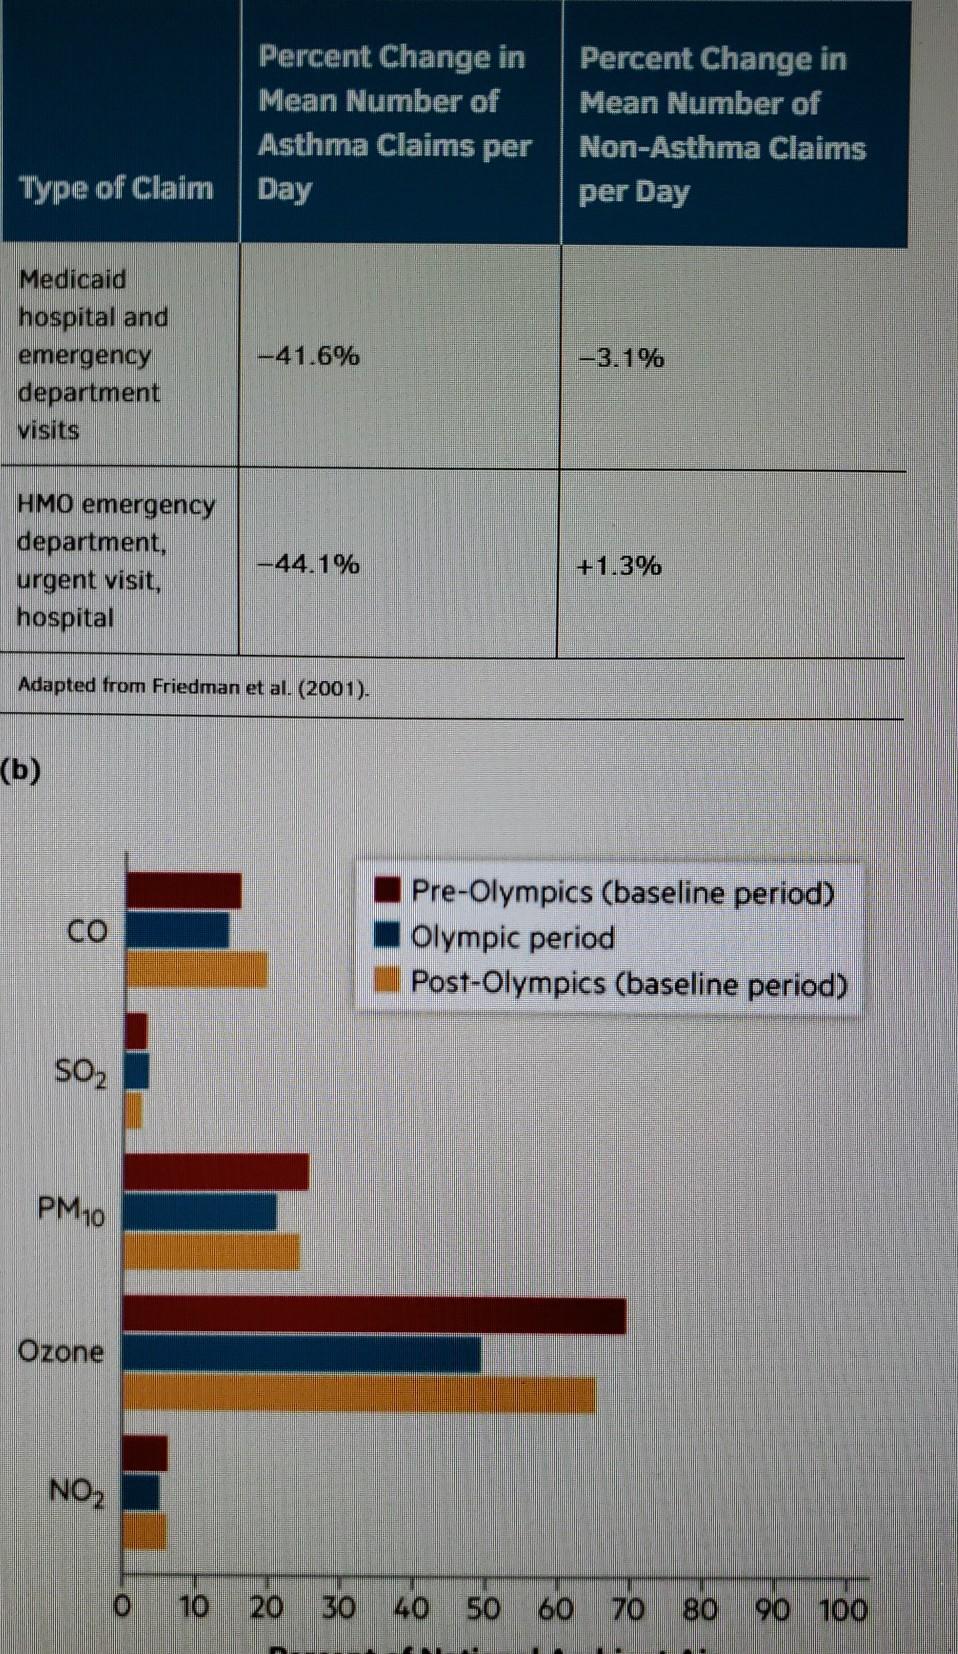
5. What are two conclusions you can draw from the data in the table and the graph? In making your conclusion, cite specific data to support your claim. 6. Make Your Case Vehicle counts during rush-hour traffic on weekdays demonstrated a 22.5% decrease in number of vehicles during the Olympic period compared to that during either baseline period. If you were an elected official in Atlanta serving on a transportation planning committee, what sort of policy recommendations would you make? Use the data in the table and the graph to raise questions and/or make your points. How might personal values (in addition to the results of this scientific inquiry) factor into your decision? Percent Change in Mean Number of Asthma Claims per Day Percent Change in Mean Number of Non-Asthma Claims per Day Type of Claim Medicaid hospital and emergency department visits 41.6% -3.1% HMO emergency department, urgent visit, hospital -44.1% +1.3% Adapted from Friedman et al. (2001). (b) CO Pre-Olympics (baseline period) Olympic period Post-Olympics (baseline period) SO2 PM10 Ozone NO2 0 10 20 30 40 50 60 70 80 90 100 5. What are two conclusions you can draw from the data in the table and the graph? In making your conclusion, cite specific data to support your claim. 6. Make Your Case Vehicle counts during rush-hour traffic on weekdays demonstrated a 22.5% decrease in number of vehicles during the Olympic period compared to that during either baseline period. If you were an elected official in Atlanta serving on a transportation planning committee, what sort of policy recommendations would you make? Use the data in the table and the graph to raise questions and/or make your points. How might personal values (in addition to the results of this scientific inquiry) factor into your decision? Percent Change in Mean Number of Asthma Claims per Day Percent Change in Mean Number of Non-Asthma Claims per Day Type of Claim Medicaid hospital and emergency department visits 41.6% -3.1% HMO emergency department, urgent visit, hospital -44.1% +1.3% Adapted from Friedman et al. (2001). (b) CO Pre-Olympics (baseline period) Olympic period Post-Olympics (baseline period) SO2 PM10 Ozone NO2 0 10 20 30 40 50 60 70 80 90 100
Step by Step Solution
There are 3 Steps involved in it
1 Expert Approved Answer
Step: 1 Unlock

Question Has Been Solved by an Expert!
Get step-by-step solutions from verified subject matter experts
Step: 2 Unlock
Step: 3 Unlock