

Question: 50 40 4 7) Complete the table below and plot the EAC as a function of time. What are your conclusions? Cumulative Cost, in Thousands
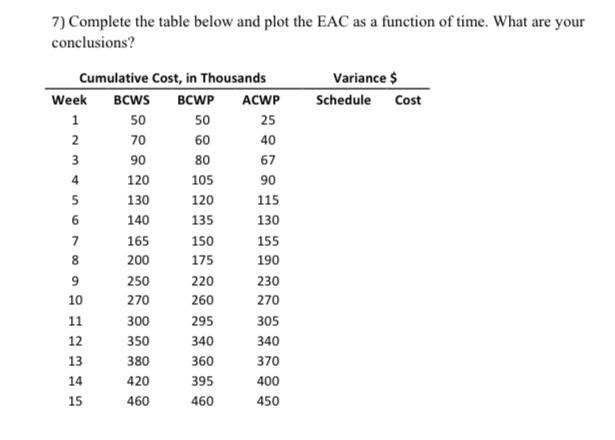
50 40 4 7) Complete the table below and plot the EAC as a function of time. What are your conclusions? Cumulative Cost, in Thousands Variance $ Week BCWS BCWP ACWP Schedule Cost 1 50 25 2 70 60 3 90 80 67 120 105 90 5 130 120 115 6 140 135 130 7 165 155 8 200 175 190 9 250 220 230 10 270 260 270 11 300 295 305 12 350 340 340 13 380 360 370 14 420 395 400 15 460 460 450 150 50 40 4 7) Complete the table below and plot the EAC as a function of time. What are your conclusions? Cumulative Cost, in Thousands Variance $ Week BCWS BCWP ACWP Schedule Cost 1 50 25 2 70 60 3 90 80 67 120 105 90 5 130 120 115 6 140 135 130 7 165 155 8 200 175 190 9 250 220 230 10 270 260 270 11 300 295 305 12 350 340 340 13 380 360 370 14 420 395 400 15 460 460 450 150
Step by Step Solution
There are 3 Steps involved in it

Get step-by-step solutions from verified subject matter experts