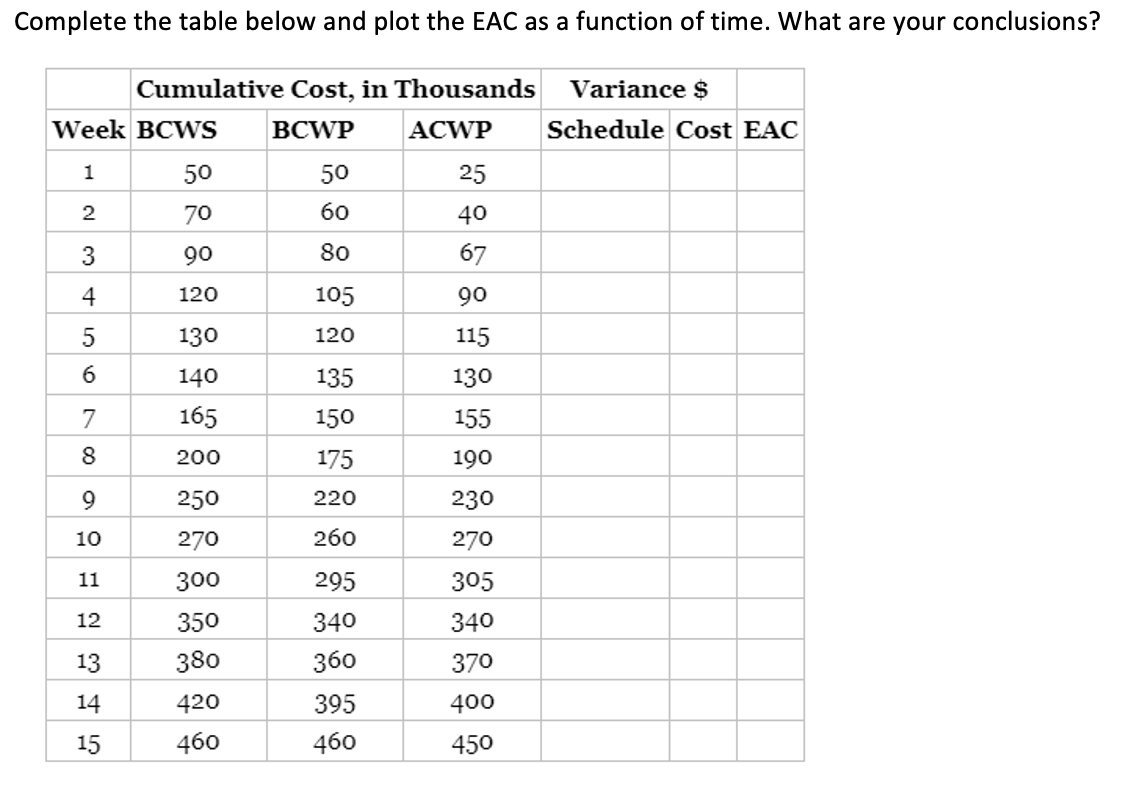
Question: Complete the table below and plot the EAC as a function of time. What are your conclusions? Cumulative Cost, in Thousands Variance $ Week BCWS

Complete the table below and plot the EAC as a

Complete the table below and plot the EAC as a function of time. What are your conclusions? Cumulative Cost, in Thousands Variance $ Week BCWS BCWP ACWP Schedule Cost EAC 1 50 50 25 2 70 60 40 3 90 80 67 4 4 120 105 90 115 130 120 5 6 6 135 130 140 165 150 155 7 8 200 175 190 9 220 250 270 10 260 230 270 305 11 300 350 295 340 12 340 13 380 360 370 14 400 420 460 395 460 15 450

Step by Step Solution

There are 3 Steps involved in it

1 Expert Approved Answer
Step: 1 Unlock blur-text-image
Question Has Been Solved by an Expert!

Get step-by-step solutions from verified subject matter experts

Step: 2 Unlock
Step: 3 Unlock

Students Have Also Explored These Related General Management Questions!