

Question: [50 points] Compute and plot the steady-state distribution of concentration for the tank shown in Figure 1. The PDE governing this system is ac
![[50 points] Compute and plot the steady-state distribution of concentration for the](https://s3.amazonaws.com/si.experts.images/answers/2024/05/6645f0b41a412_6356645f0b4007ef.jpg)
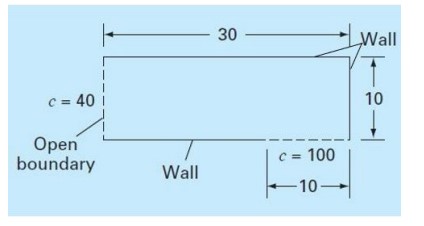
[50 points] Compute and plot the steady-state distribution of concentration for the tank shown in Figure 1. The PDE governing this system is ac ac D - kc = 0 x2 2, and the boundary conditions are as shown. Employ a value of 0.5 for D and 0.1 for k. Use a small enough Ar = Ay = 0.5 so that your answer does not depend on the value. The wall boundary conditions correspond to zero derivative in the direction normal to the wall. c = 40 30 Wall T 10 Open boundary c = 100 Wall -10-
Step by Step Solution
There are 3 Steps involved in it
1 Expert Approved Answer
Step: 1 Unlock

Question Has Been Solved by an Expert!
Get step-by-step solutions from verified subject matter experts
Step: 2 Unlock
Step: 3 Unlock