

Question: 5:11 - MOMY Height Project Instruct... . . . MAT0027 - Statistics for the Health Sciences, Winter 2021 Height Project, Part C (4%) To complete
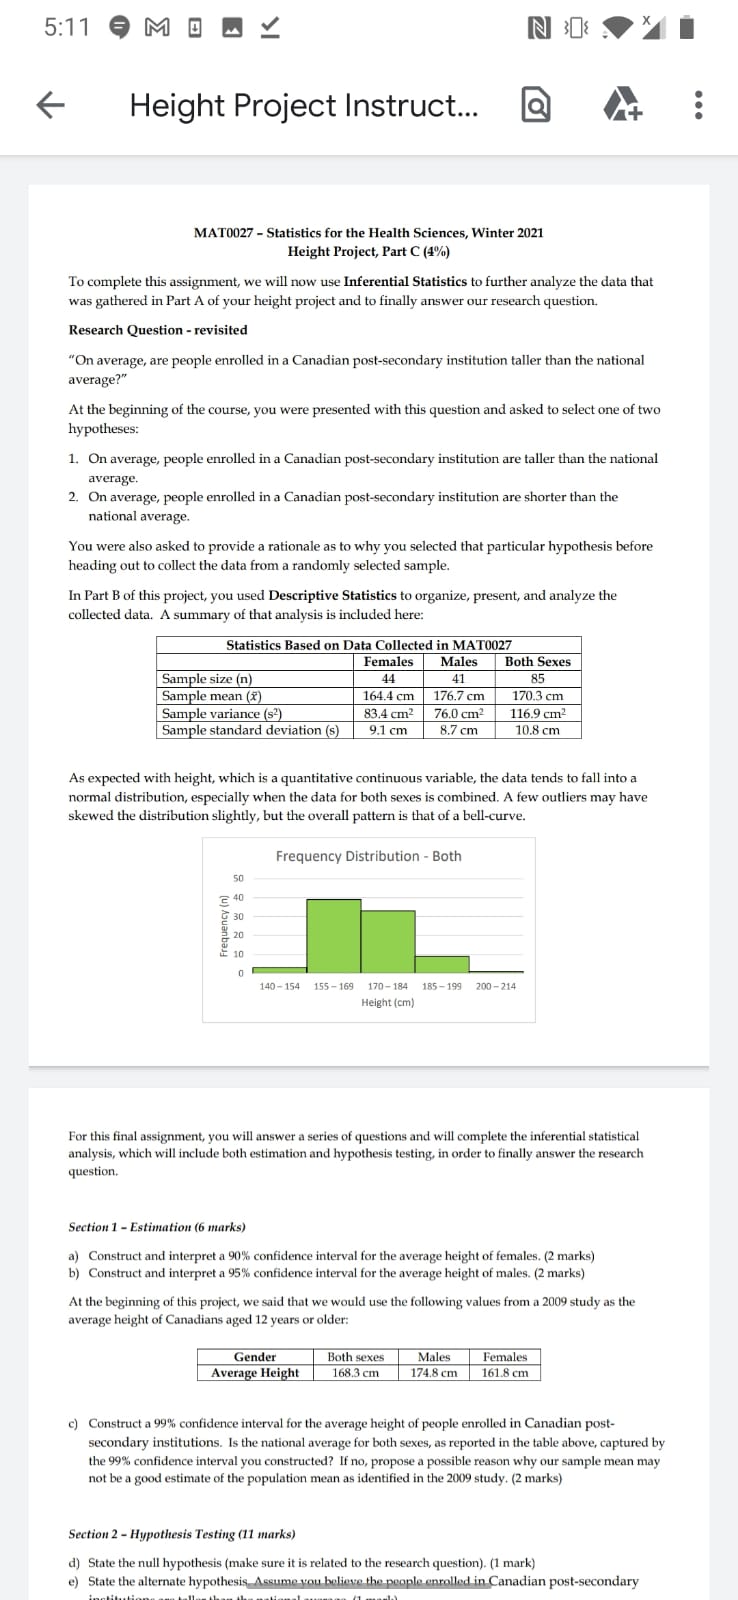
5:11 - MOMY Height Project Instruct... . . . MAT0027 - Statistics for the Health Sciences, Winter 2021 Height Project, Part C (4%) To complete this assignment, we will now use Inferential Statistics to further analyze the data that was gathered in Part A of your height project and to finally answer our research question. Research Question - revisited "On average, are people enrolled in a Canadian post-secondary institution taller than the national average?" At the beginning of the course, you were presented with this question and asked to select one of two hypotheses: 1. On average, people enrolled in a Canadian post-secondary institution are taller than the national average. 2. On average, people enrolled in a Canadian post-secondary institution are shorter than the national average. You were also asked to provide a rationale as to why you selected that particular hypothesis before heading out to collect the data from a randomly selected sample. In Part B of this project, you used Descriptive Statistics to organize, present, and analyze the collected data. A summary of that analysis is included here: Statistics Based on Data Collected in MAT0027 Females Males Both Sexes Sample size (n) 41 85 Sample mean (x) 164.4 cm 176.7 cm 170.3 cm Sample variance (s?) 83.4 cm2 76.0 cm 116.9 cm Sample standard deviation (s) 9.1 cm 8.7 cm 10.8 cm As expected with height, which is a quantitative continuous variable, the data tends to fall into a normal distribution, especially when the data for both sexes is combined. A few outliers may have skewed the distribution slightly, but the overall pattern is that of a bell-curve. Frequency Distribution - Both 50 30 Frequency( 20 10 140-154 155-169 170-184 185-199 200-214 Height (cm) For this final assignment, you will answer a series of questions and will complete the inferential statistical analysis, which will include both estimation and hypothesis testing, in order to finally answer the research question. Section 1 - Estimation (6 marks) a) Construct and interpret a 90% confidence interval for the average height of females. (2 marks) b) Construct and interpret a 95% confidence interval for the average height of males. (2 marks) At the beginning of this project, we said that we would use the following values from a 2009 study as the average height of Canadians aged 12 years or older: Gender Both sexes Males Females Average Height 168.3 cm 174.8 cm 161.8 cm c) Construct a 99% confidence interval for the average height of people enrolled in Canadian post- secondary institutions. Is the national average for both sexes, as reported in the table above, captured by the 99% confidence interval you constructed? If no, propose a possible reason why our sample mean may not be a good estimate of the population mean as identified in the 2009 study. (2 marks) Section 2 - Hypothesis Testing (11 marks) d) State the null hypothesis (make sure it is related to the research question). (1 mark) e) State the alternate hypothesis Assume you believe the people enrolled in Canadian post-secondary
Step by Step Solution
There are 3 Steps involved in it

Get step-by-step solutions from verified subject matter experts