

Question: 5.Examine the scatter plots below for potential associations between referral time and volume and referral time and proportion of urgent vs non-urgent referrals: a) Average
5.Examine the scatter plots below for potential associations between referral time and volume and referral time and proportion of urgent vs non-urgent referrals: a) Average daily time for each time component by daily volume (4 scatter plots), b) Average daily time for each component by daily percentage urgent (4 scatter plots).Note: these analyses come from data that have been aggregated by day. What do you learn from these scatter plots? a) Average daily time for each component by daily volume (4 scatter plots)
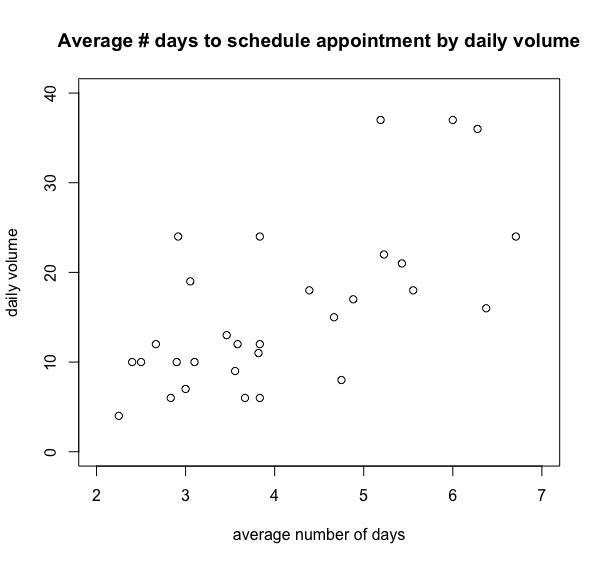
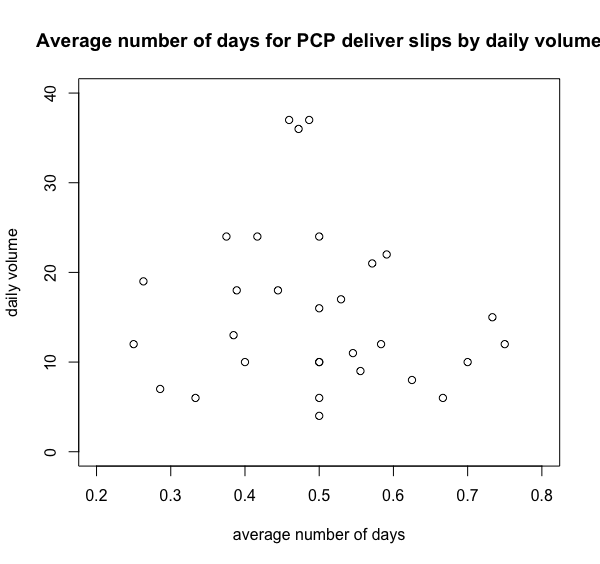
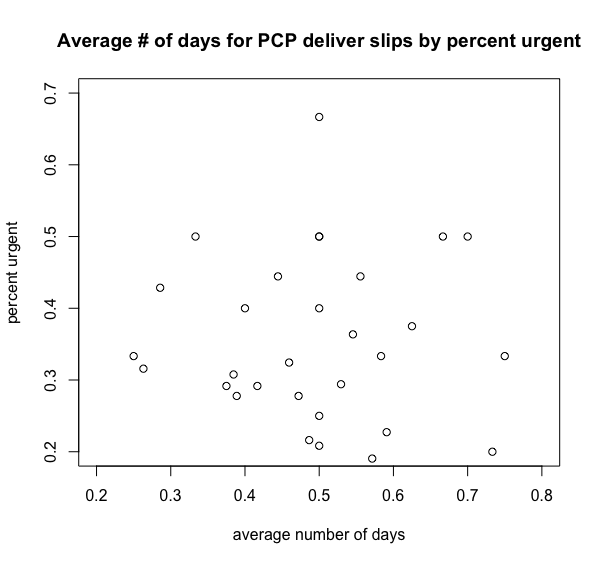
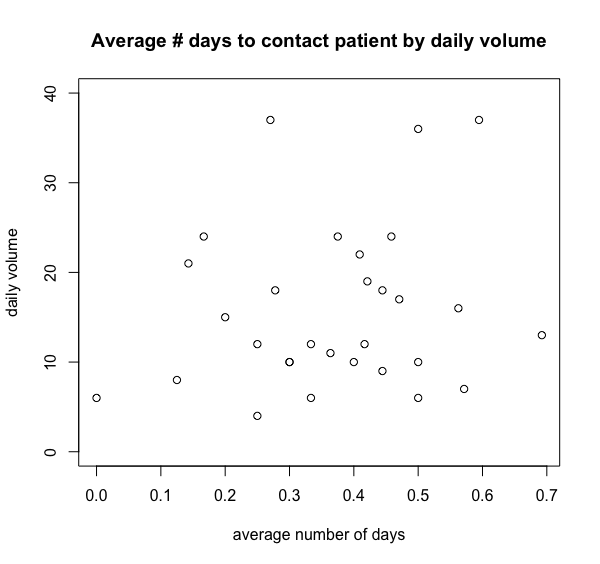
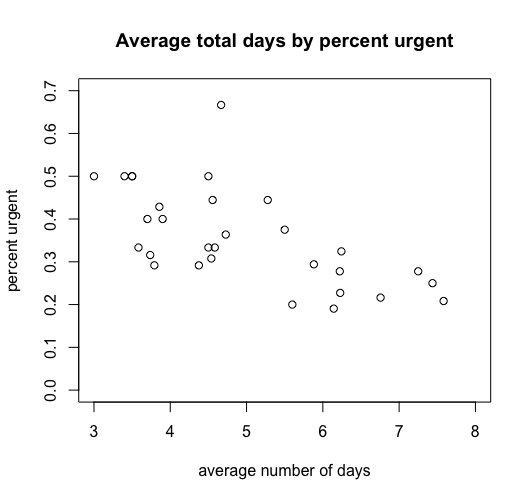
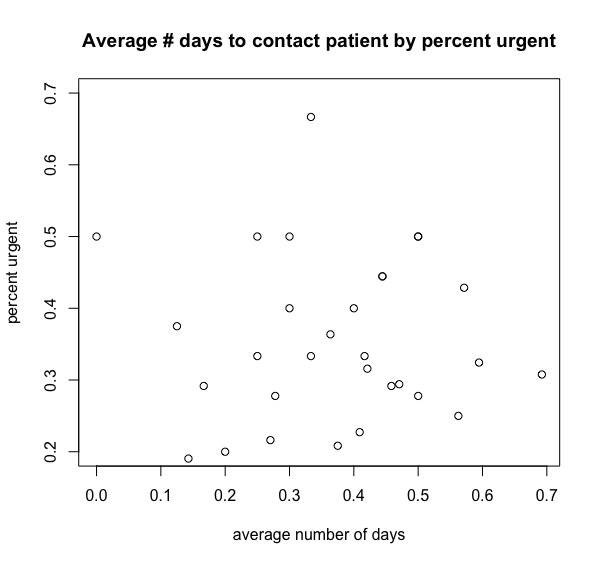
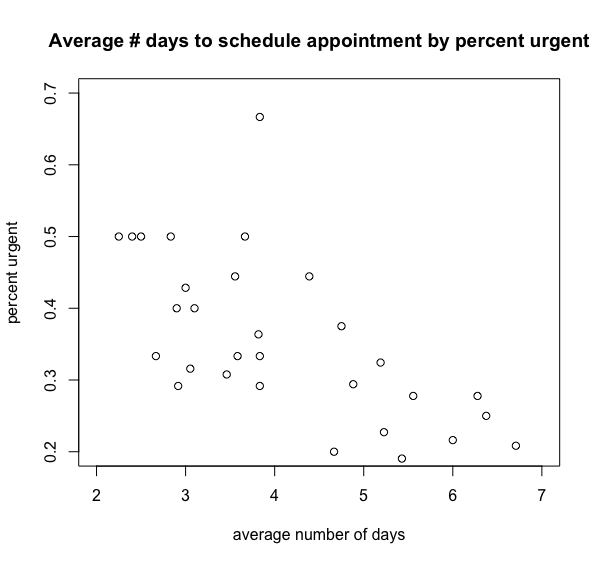
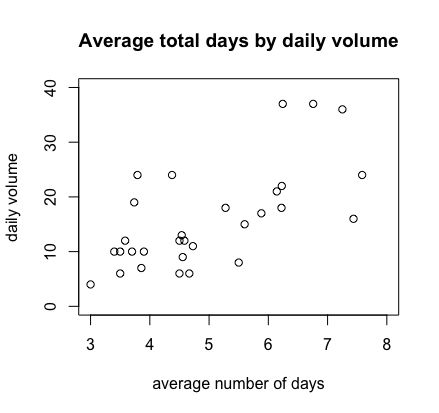
Average # days to schedule appointment by daily volume O O O O O O daily volume & O O O O O O OO DO 0 0 O O O O 0 0 O O 2 4 5 6 7 average number of daysAverage number of days for PCP deliver slips by daily volume O O daily volume & O O O O O O O O O O O O O O O O O O 0.2 0.3 0.4 0.5 0.6 0.7 0.8 average number of daysAverage # of days for PCP deliver slips by percent urgent 0.7 O 0.6 0.5 O O O O percent urgent O O O O O O o O 0.3 O O O O O O O O 0.2 0.3 0.4 0.5 0.6 0.7 0.8 average number of daysAverage # days to contact patient by daily volume O O O O O O O O daily volume & O O OO O O O O O 2 O O O O O O O O O O 0.0 0.1 0.2 0.3 0.4 0.5 0.6 0.7 average number of daysAverage total days by percent urgent O O O O O percent urgent 0.0 0.1 0.2 0.3 0.4 0.5 0.6 0.7 O 8 O Oo0 0 O O 4 5 6 8 average number of daysAverage # days to contact patient by percent urgent O 0.6 0.5 O O O O percent urgent O O O O O 0.3 O O OO O O O O O O O O 0.0 0.1 0.2 0.3 0.4 0.5 0.6 0.7 average number of dayspercent urgent Average # days to schedule appointment by percent urgent CL? {16 15 14 13.3 {LE average number of days Average total days by daily volume 0 0 0 O O O 20 daily volume O O O O O O O 2 0 0 0 O O O O OO O O 4 5 6 8 average number of days
Step by Step Solution
There are 3 Steps involved in it

Get step-by-step solutions from verified subject matter experts