

Question: 6 . 5 . The table below shows the demand for a particular product in a department store in each of the last twelve months.
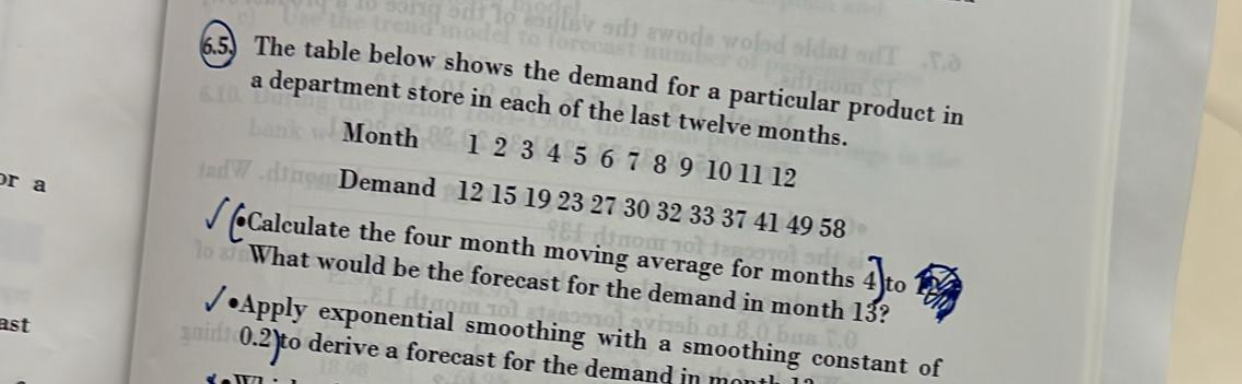
The table below shows the demand for a particular product in a department store in each of the last twelve months.
Month
Demand
Calculate the four month moving average for months
Apply exponential smoothing with a smoothing constant of
Step by Step Solution
There are 3 Steps involved in it
1 Expert Approved Answer
Step: 1 Unlock

Question Has Been Solved by an Expert!
Get step-by-step solutions from verified subject matter experts
Step: 2 Unlock
Step: 3 Unlock