

Question: 6 . 5 . The table below shows the demand for a particular product in a department store in each of the last twelve months.
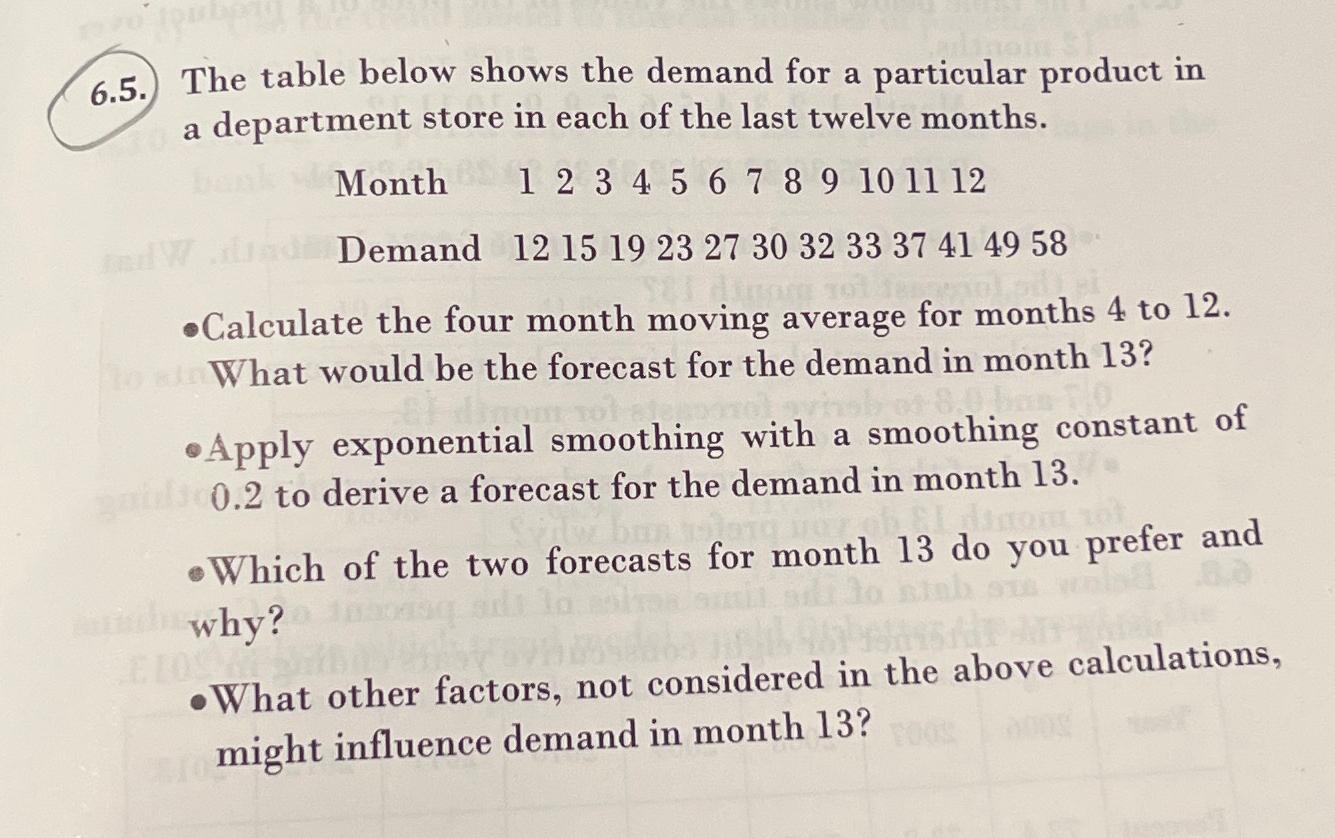
The table below shows the demand for a particular product in a department store in each of the last twelve months.
tableMonthDemand
Calculate the four month moving average for months to What would be the forecast for the demand in month
Apply exponential smoothing with a smoothing constant of to derive a forecast for the demand in month
Which of the two forecasts for month do you prefer and why?
What other factors, not considered in the above calculations, might influence demand in month
Step by Step Solution
There are 3 Steps involved in it
1 Expert Approved Answer
Step: 1 Unlock

Question Has Been Solved by an Expert!
Get step-by-step solutions from verified subject matter experts
Step: 2 Unlock
Step: 3 Unlock