

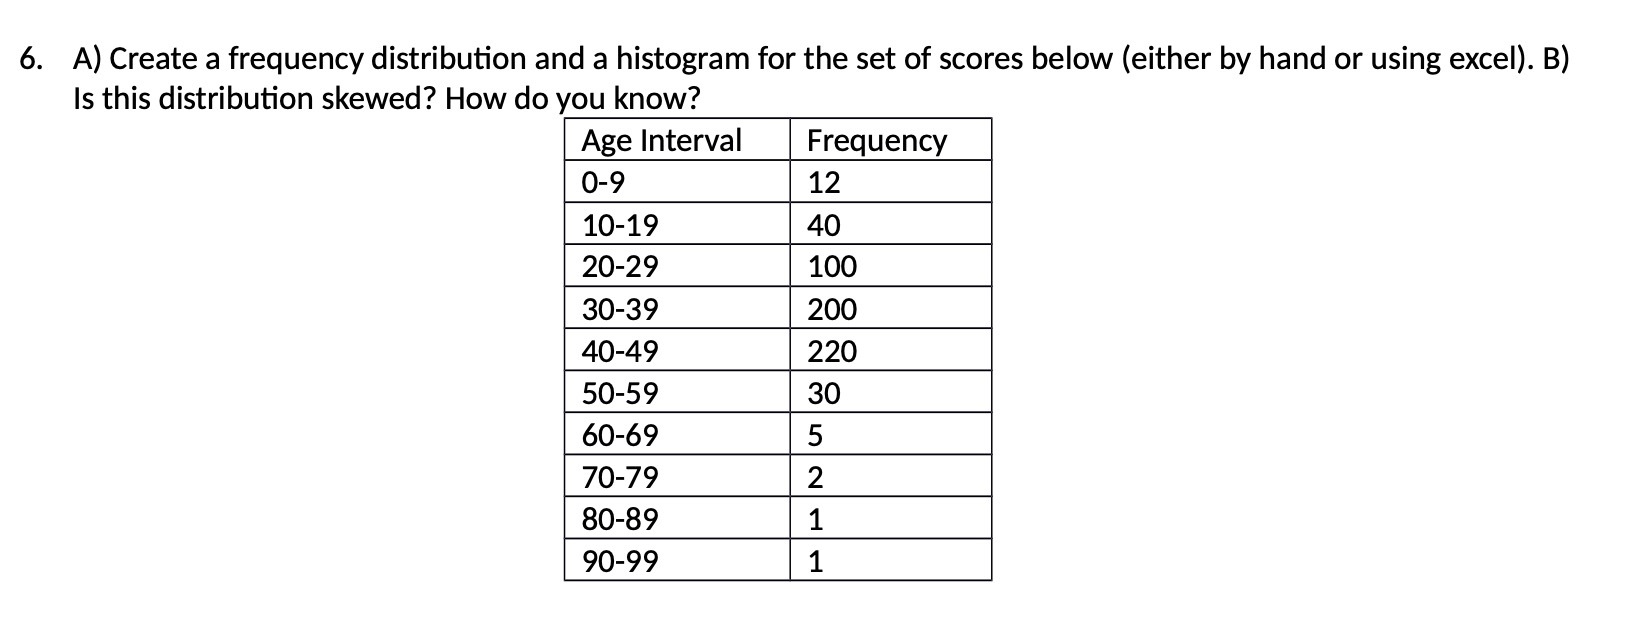
Question: 6. A) Create a frequency distribution and a histogram for the set of scores below (either by hand or using excel). B) Is this distribution
Step by Step Solution
There are 3 Steps involved in it
1 Expert Approved Answer
Step: 1 Unlock

Question Has Been Solved by an Expert!
Get step-by-step solutions from verified subject matter experts
Step: 2 Unlock
Step: 3 Unlock