

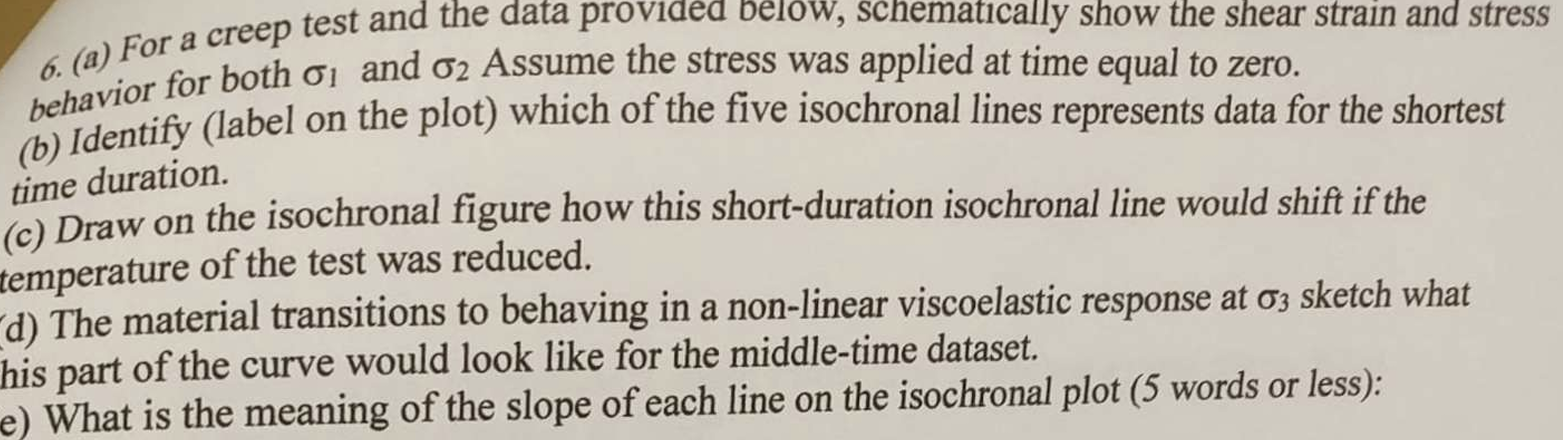
Question: 6 . ( a ) For a creep test and the data provided below, schematically show the shear strain and stress behavior for both
a For a creep test and the data provided below, schematically show the shear strain and stress behavior for both sigma and sigma Assume the stress was applied at time equal to zero.
b Identify label on the plot which of the five isochronal lines represents data for the shortest time duration.
c Draw on the isochronal figure how this shortduration isochronal line would shift if the temperature of the test was reduced.
d The material transitions to behaving in a nonlinear viscoelastic response at sigma sketch what his part of the curve would look like for the middletime dataset.
e What is the meaning of the slope of each line on the isochronal plot words or less: Shear Strain Data
Shear Strain Data
Step by Step Solution
There are 3 Steps involved in it
1 Expert Approved Answer
Step: 1 Unlock

Question Has Been Solved by an Expert!
Get step-by-step solutions from verified subject matter experts
Step: 2 Unlock
Step: 3 Unlock