

Question: 6. Analyze the graphics and summary statistics for the data sets a. and b. below. Use the rules of thumb for the Central Limit Theorem
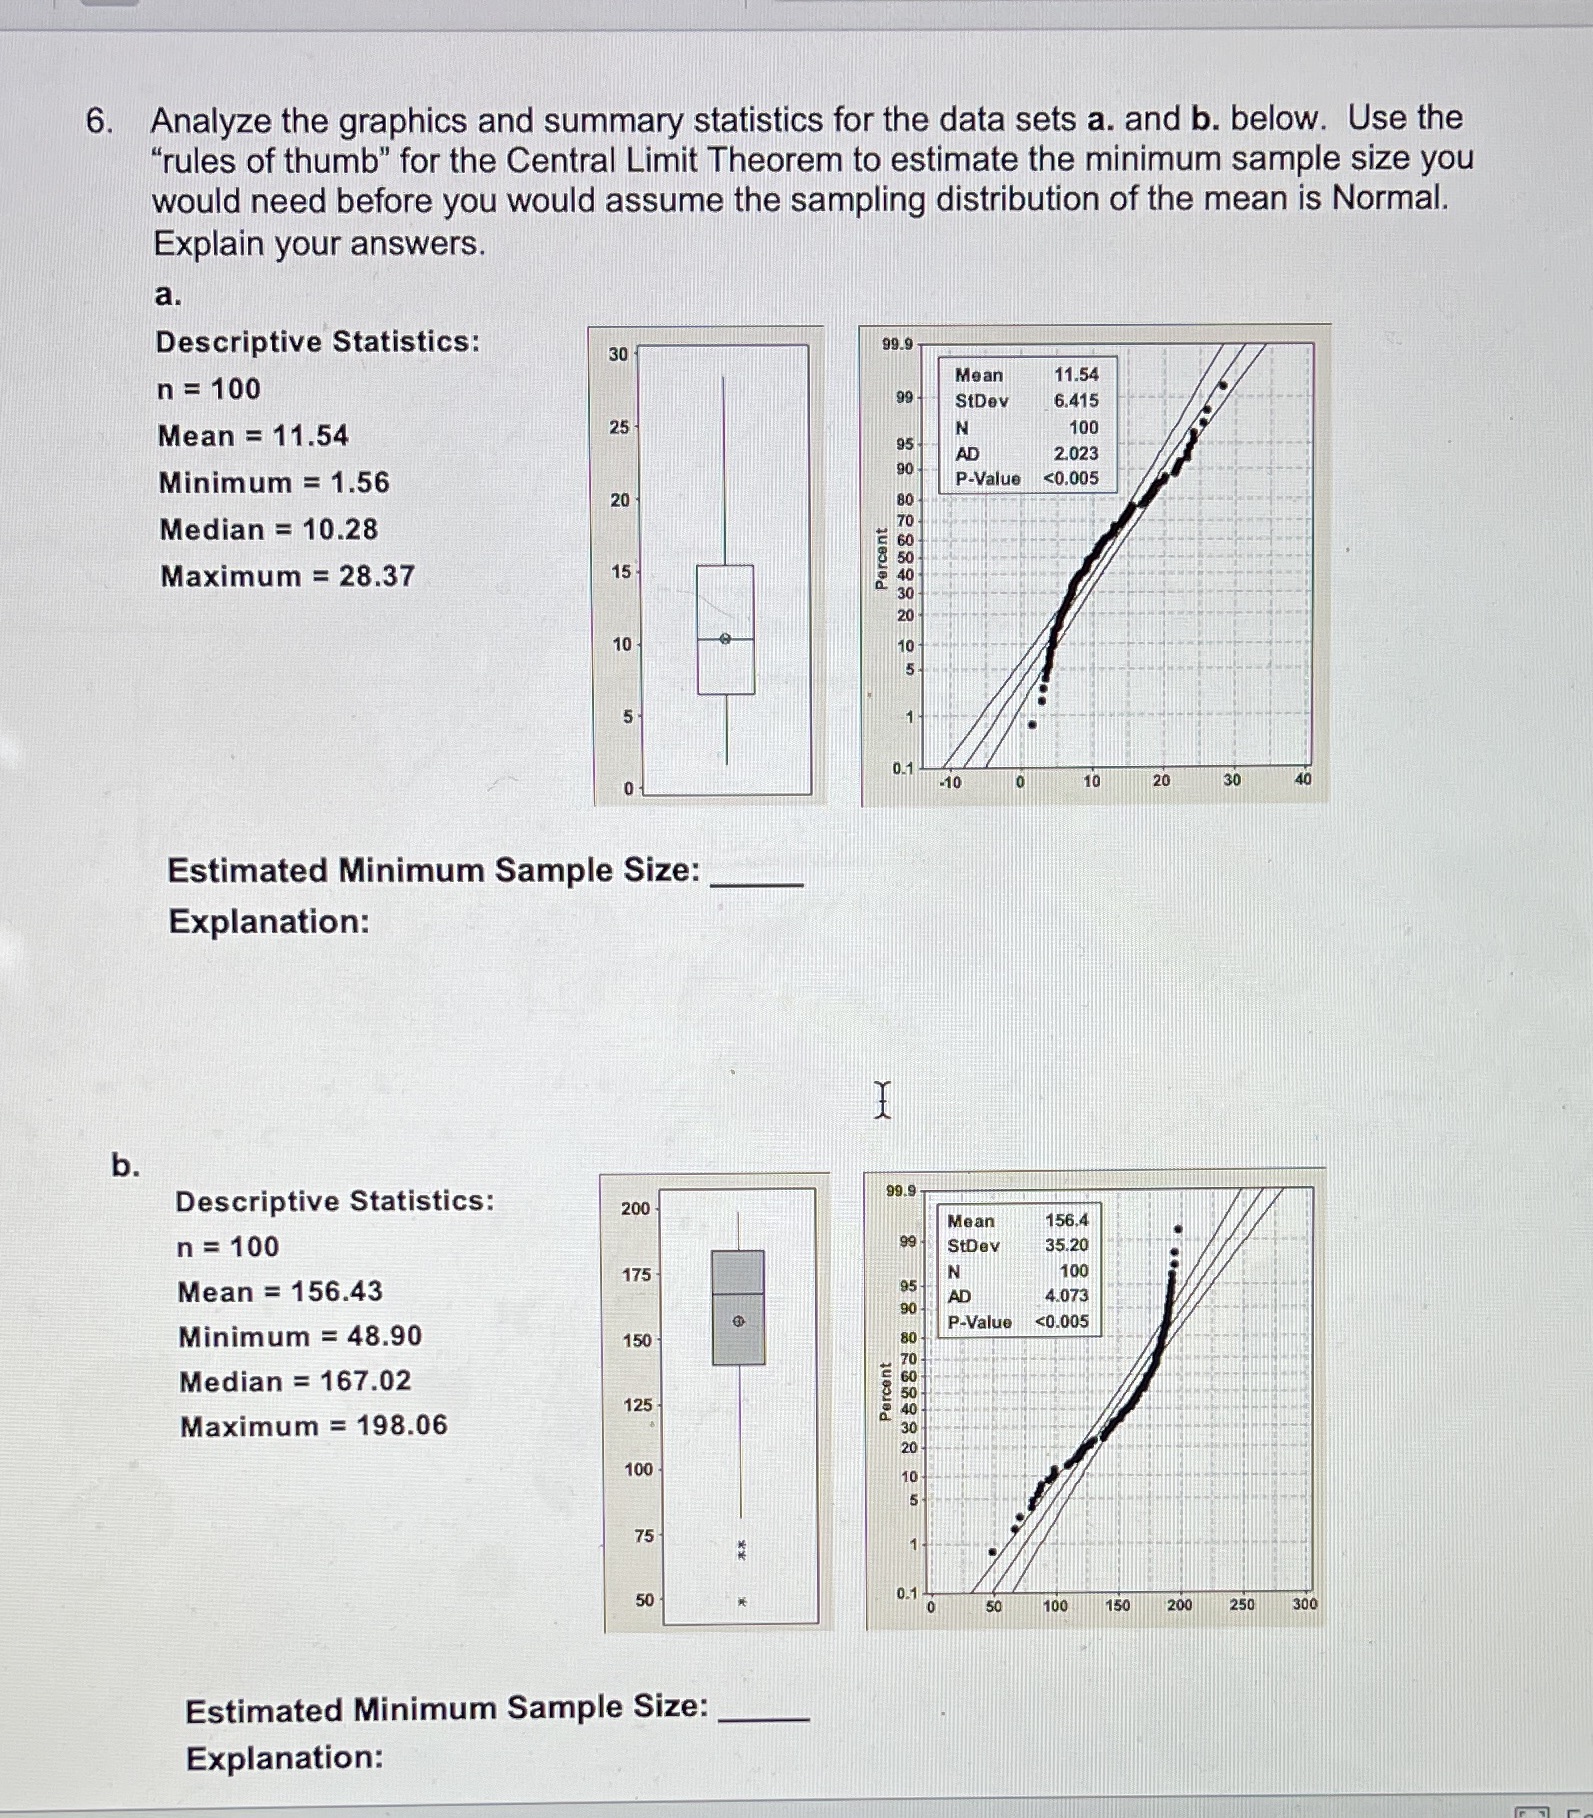
6. Analyze the graphics and summary statistics for the data sets a. and b. below. Use the "rules of thumb" for the Central Limit Theorem to estimate the minimum sample size you would need before you would assume the sampling distribution of the mean is Normal. Explain your answers. a. Descriptive Statistics: 99.9 30 n = 100 Mean 11.54 99 StDev 6.415 Mean = 11.54 25 N 100 95 AD 2.023 Minimum = 1.56 P-Value
Step by Step Solution
There are 3 Steps involved in it
1 Expert Approved Answer
Step: 1 Unlock

Question Has Been Solved by an Expert!
Get step-by-step solutions from verified subject matter experts
Step: 2 Unlock
Step: 3 Unlock