

Question: 6. Changes in taxes The following graph plots an aggregate demand curve. Using the graph, shift the aggregate demand curve to depict the impact that

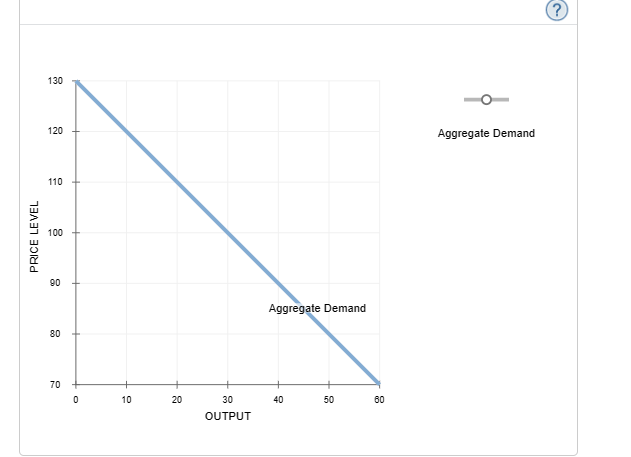

6. Changes in taxes The following graph plots an aggregate demand curve. Using the graph, shift the aggregate demand curve to depict the impact that a tax cut has on the economy. ? 130 O 120 Aggregate Demand 110 100 PRICE LEVEL 90 Aggregate Demand 80 70 20 30 50 80 10 40 OUTPUTSuppose the governments of two very similar economies, economy Y and economy Z, implement a permanent tax cut of equal size. The marginal propensity to consume (MPC) in economy Y is 0.75 and the MPC in economy Z is 0.8. The economies are otherwise completely identical. The tax cut will have a larger impact on aggregate demand in the economy with the h A
Step by Step Solution
There are 3 Steps involved in it

Get step-by-step solutions from verified subject matter experts