

Question: help with question 6. Changes in taxes The following graph shows the aggregate demand curve. Shift the aggregate demand curve on the graph to show
help with question
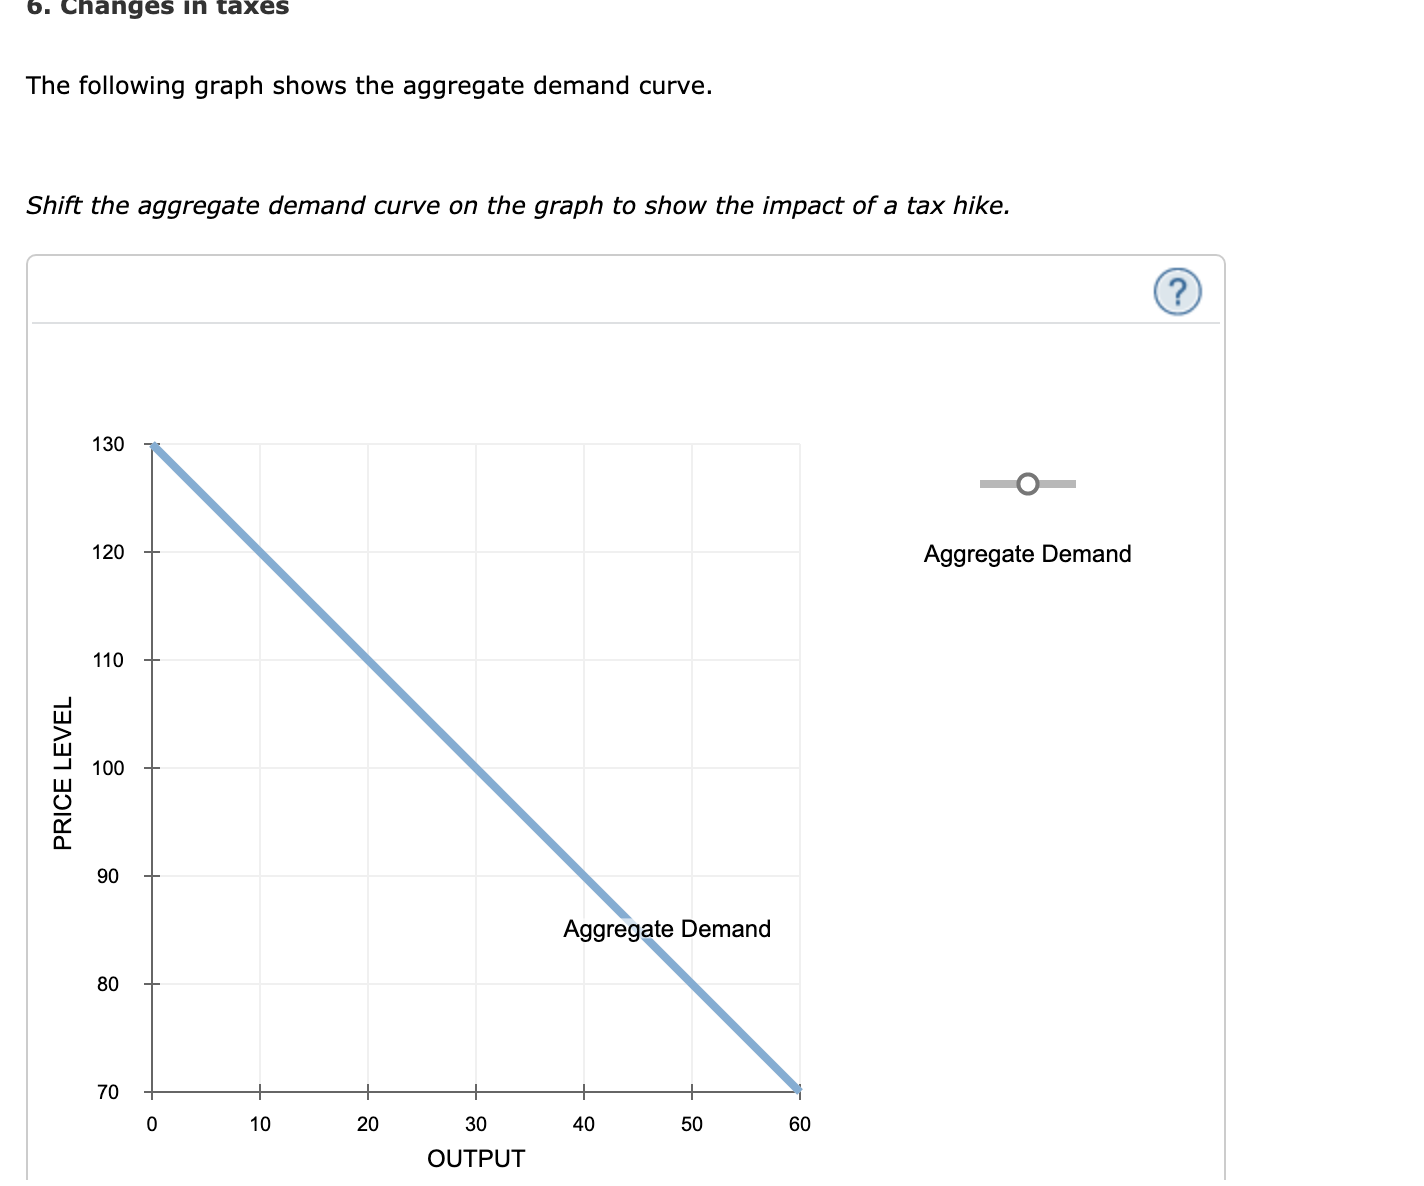
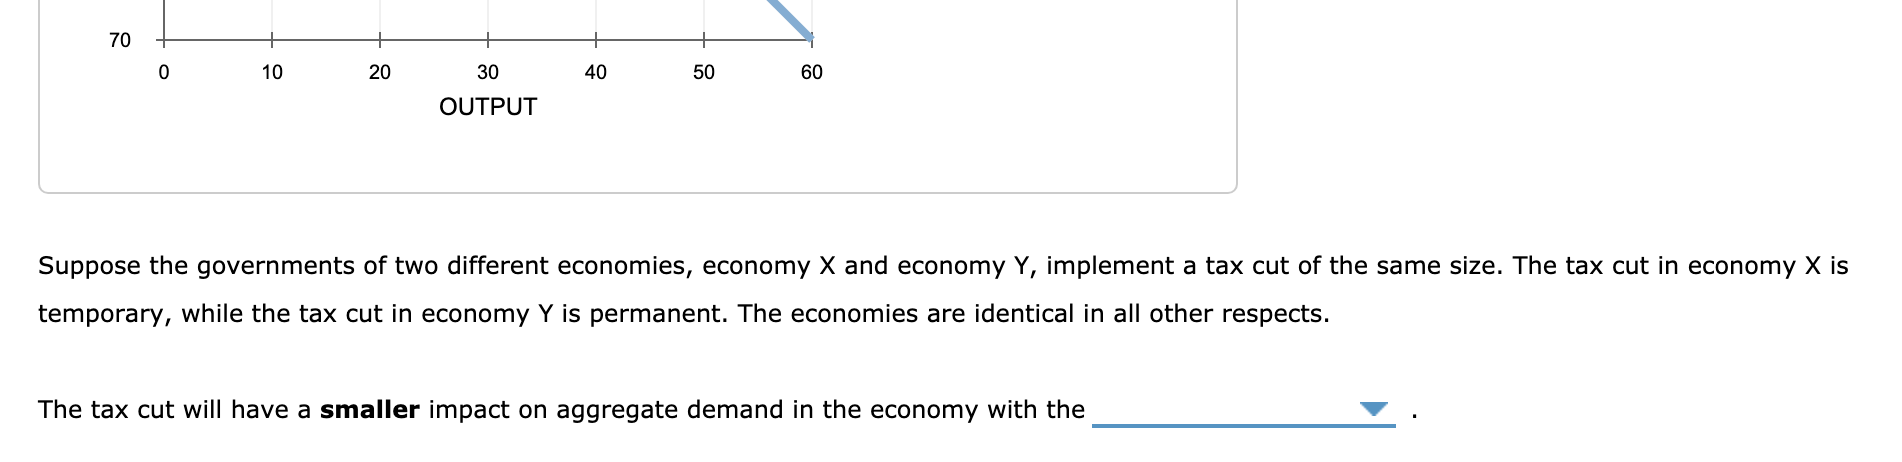
6. Changes in taxes The following graph shows the aggregate demand curve. Shift the aggregate demand curve on the graph to show the impact of a tax hike. 130 O 120 Aggregate Demand 110 PRICE LEVEL 100 90 Aggregate Demand 80 70 0 10 20 30 40 50 60 OUTPUTo 10 20 30 4o 50 60 OUTPUT Suppose the governments of two different economies, economy X and economy Y, implement a tax cut of the same size. The tax cut in economy X is temporary, while the tax cut in economy Y is permanent. The economies are identical in all other respects. The tax cut will have a smaller impact on aggregate demand in the economy with the v
Step by Step Solution
There are 3 Steps involved in it

Get step-by-step solutions from verified subject matter experts