

Question: 6. Changes in taxes The following graph shows the aggregate demand curve. Shift the aggregate demand curve on the graph to show the impact of
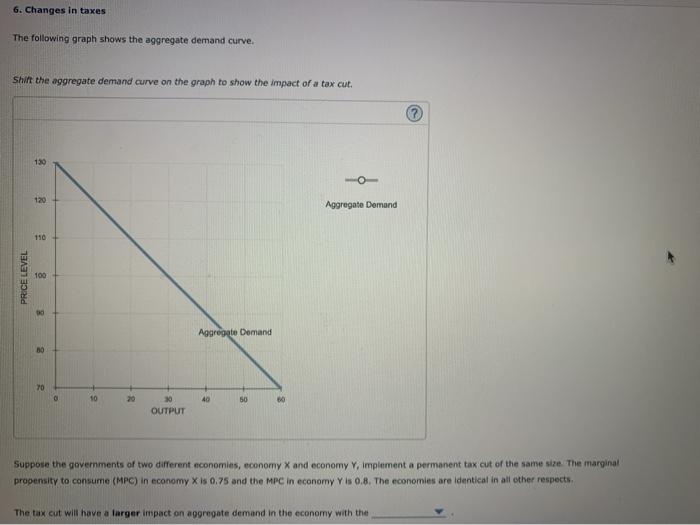
6. Changes in taxes The following graph shows the aggregate demand curve. Shift the aggregate demand curve on the graph to show the impact of a tax cut. 130 120 Aggregate Demand 110 PRICE LEVEL 100 Aggregate Demand YO 10 40 50 30 OUTPUT Suppose the governments of two different economies, economy and economy Y. Implement a permanent tax cut of the same size. The marginal propensity to consume (MPC) in economy is 0.75 and the MPC in economy is 0.8. The economies are identical in all other respects The tax cut will have a larger impact on aggregate demand in the economy with the
Step by Step Solution
There are 3 Steps involved in it
1 Expert Approved Answer
Step: 1 Unlock

Question Has Been Solved by an Expert!
Get step-by-step solutions from verified subject matter experts
Step: 2 Unlock
Step: 3 Unlock