

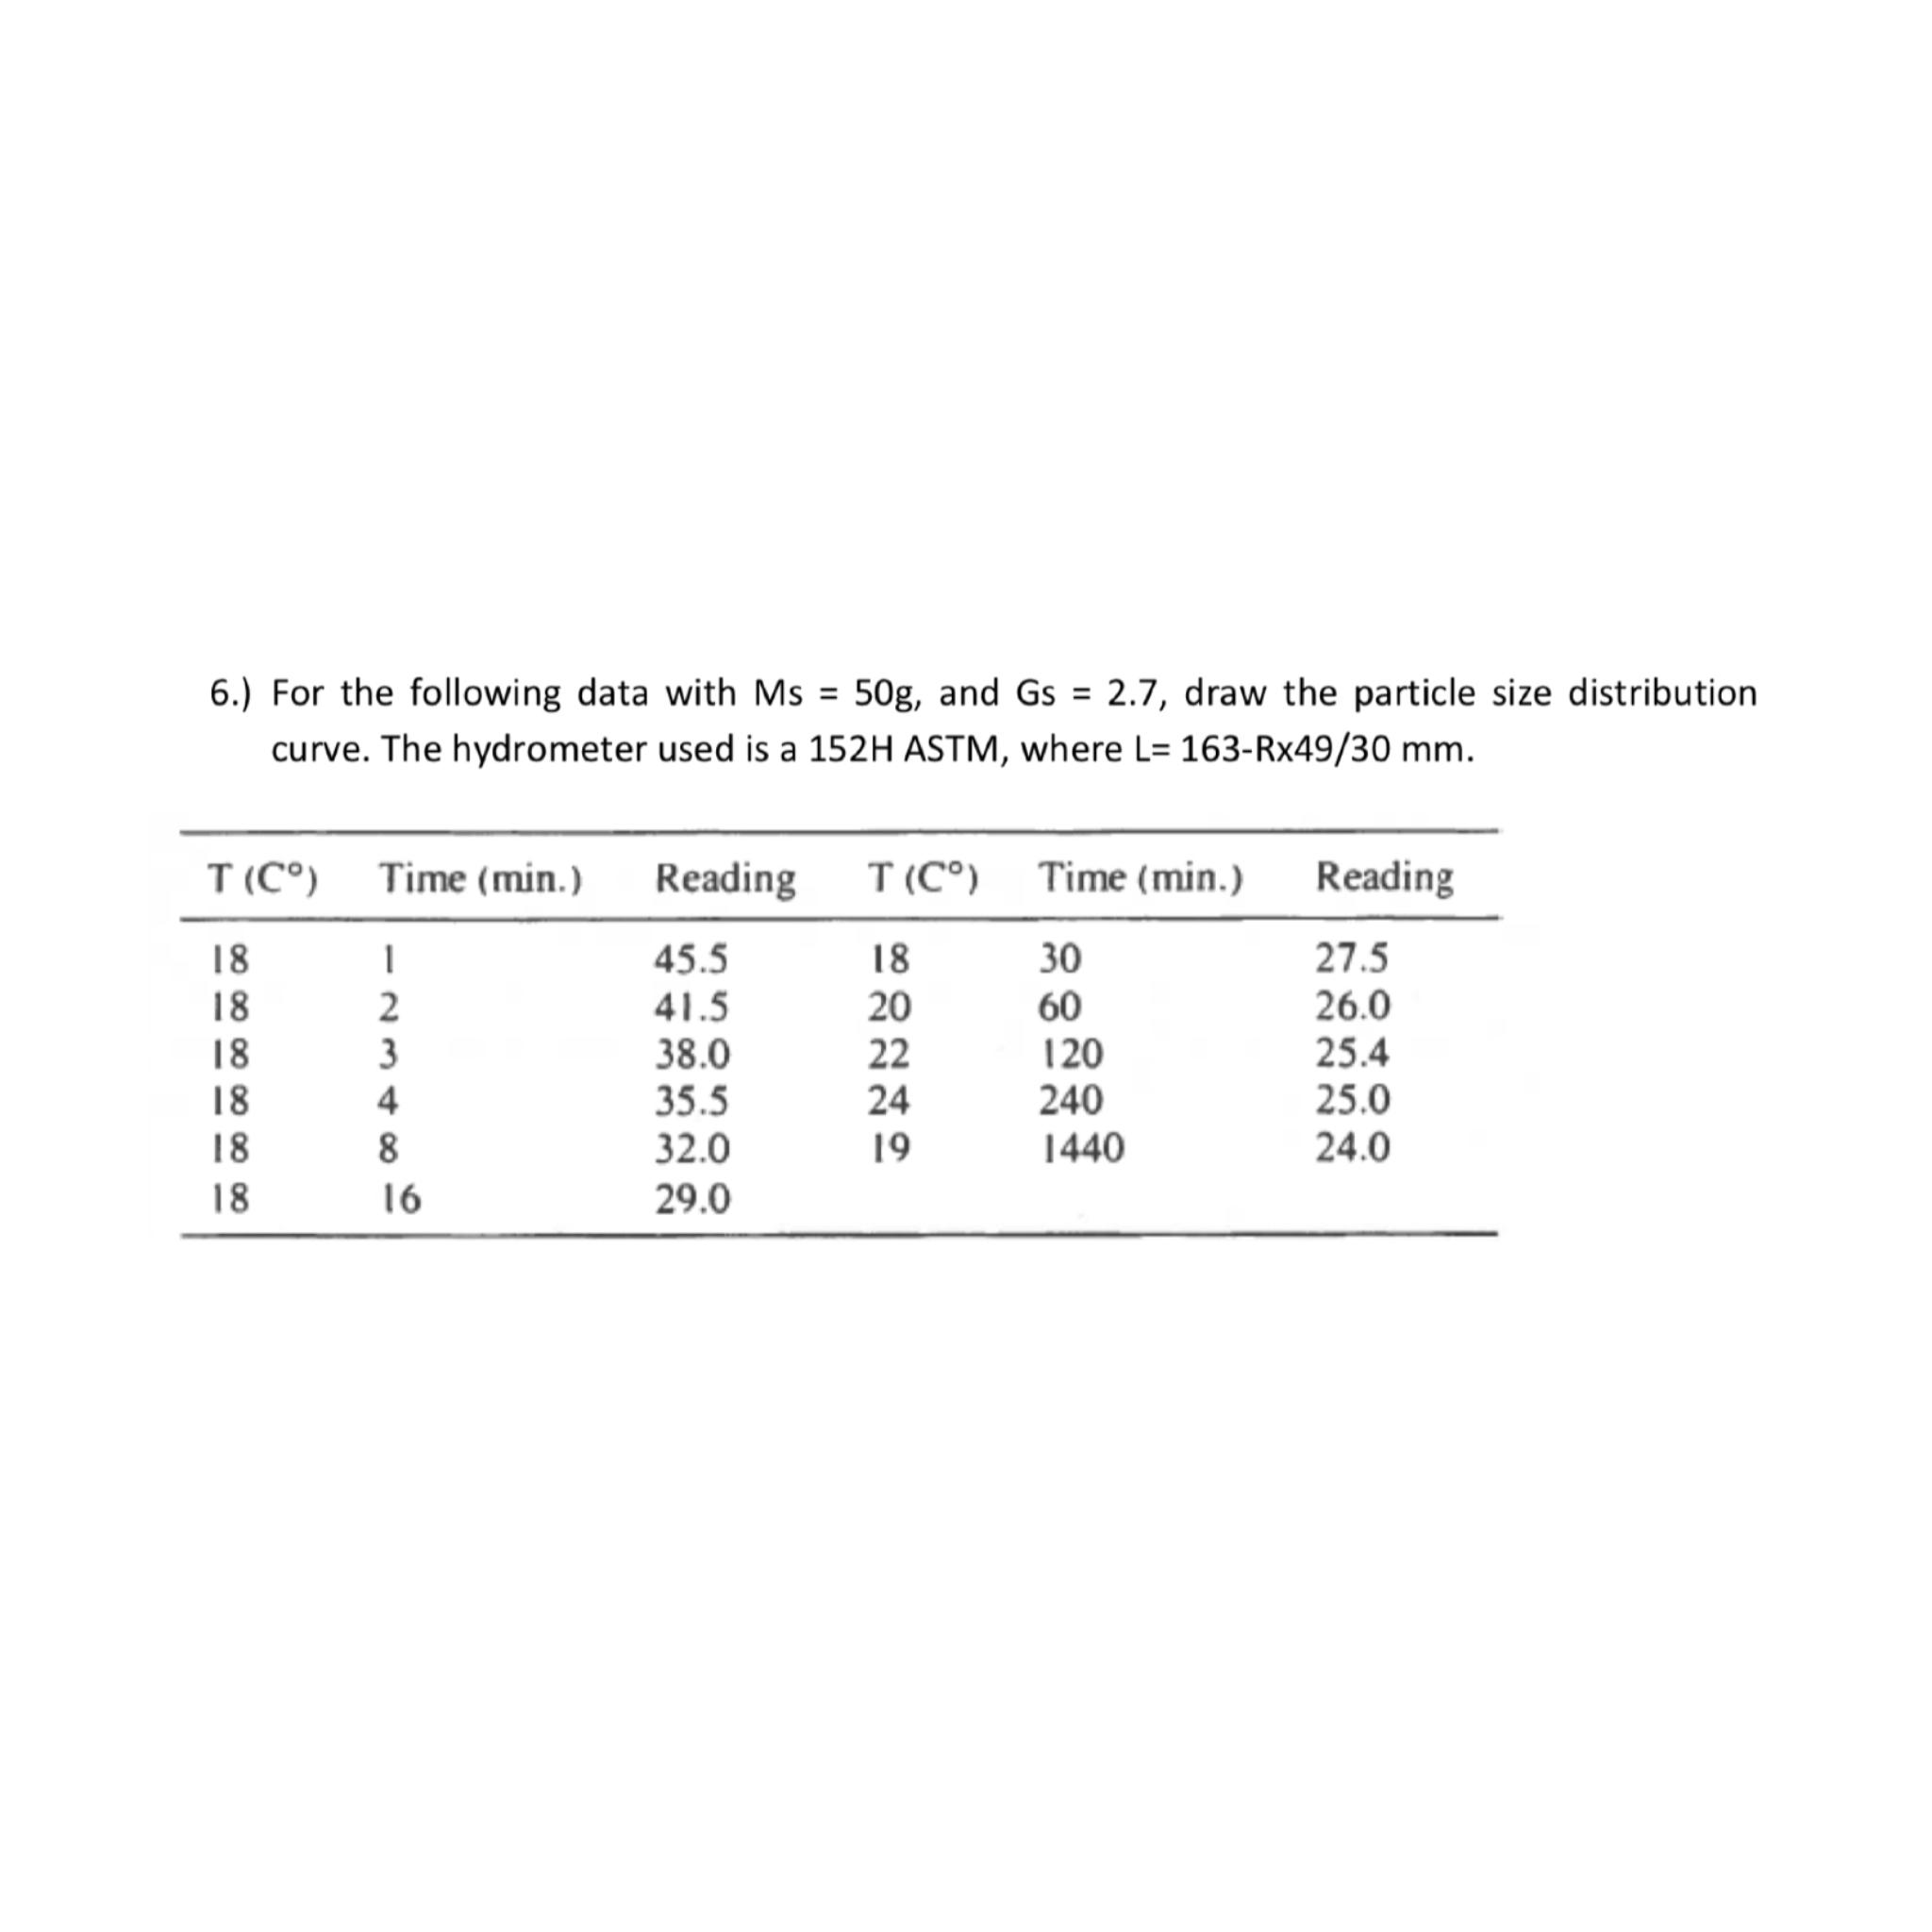
Question: 6 . ) For the following data with M s = 5 0 g , and G s = 2 . 7 , draw the
For the following data with and draw the particle size distribution curve. The hydrometer used is a ASTM, where
tableTime minReading,Time minReading
Step by Step Solution
There are 3 Steps involved in it
1 Expert Approved Answer
Step: 1 Unlock

Question Has Been Solved by an Expert!
Get step-by-step solutions from verified subject matter experts
Step: 2 Unlock
Step: 3 Unlock