

Question: 6. Perform a sensitivity analysis on four parameters: Select four parameters from the list below and clearly explain why those parameters are important to analyze
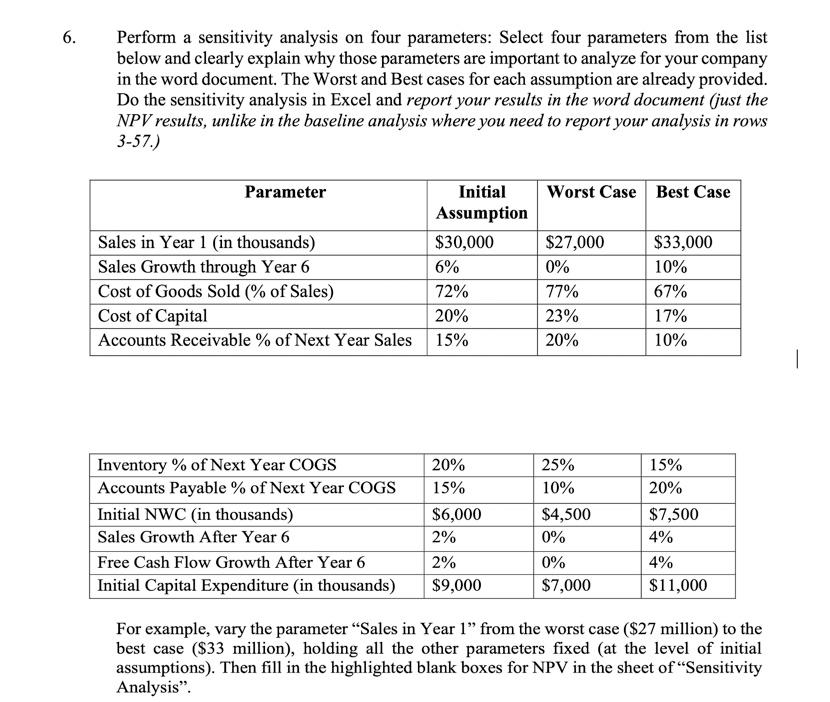
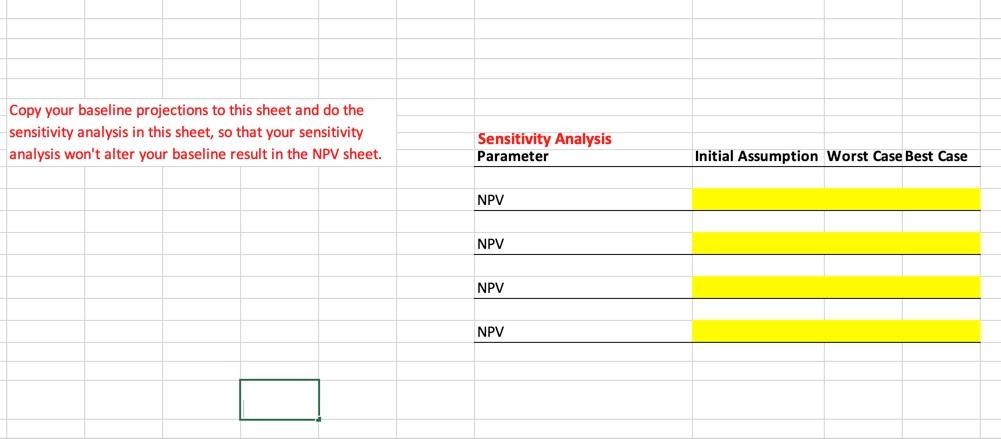
6. Perform a sensitivity analysis on four parameters: Select four parameters from the list below and clearly explain why those parameters are important to analyze for your company in the word document. The Worst and Best cases for each assumption are already provided. Do the sensitivity analysis in Excel and report your results in the word document (just the NPV results, unlike in the baseline analysis where you need to report your analysis in rows 3-57.) Parameter Worst Case Best Case Sales in Year 1 (in thousands) Sales Growth through Year 6 Cost of Goods Sold (% of Sales) Cost of Capital Accounts Receivable % of Next Year Sales Initial Assumption $30,000 6% 72% 20% 15% $27,000 0% 77% 23% 20% $33,000 10% 67% 17% 10% Inventory % of Next Year COGS Accounts Payable % of Next Year COGS Initial NWC (in thousands) Sales Growth After Year 6 Free Cash Flow Growth After Year 6 Initial Capital Expenditure (in thousands) 20% 15% $6,000 2% 2% $9,000 25% 10% $4,500 0% 0% $7,000 15% 20% $7,500 4% 4% $11,000 For example, vary the parameter Sales in Year 1" from the worst case ($27 million) to the best case ($33 million), holding all the other parameters fixed (at the level of initial assumptions). Then fill in the highlighted blank boxes for NPV in the sheet of Sensitivity Analysis". Copy your baseline projections to this sheet and do the sensitivity analysis in this sheet, so that your sensitivity analysis won't alter your baseline result in the NPV sheet. Sensitivity Analysis Parameter Initial Assumption Worst Case Best Case NPV NPV NPV NPV 6. Perform a sensitivity analysis on four parameters: Select four parameters from the list below and clearly explain why those parameters are important to analyze for your company in the word document. The Worst and Best cases for each assumption are already provided. Do the sensitivity analysis in Excel and report your results in the word document (just the NPV results, unlike in the baseline analysis where you need to report your analysis in rows 3-57.) Parameter Worst Case Best Case Sales in Year 1 (in thousands) Sales Growth through Year 6 Cost of Goods Sold (% of Sales) Cost of Capital Accounts Receivable % of Next Year Sales Initial Assumption $30,000 6% 72% 20% 15% $27,000 0% 77% 23% 20% $33,000 10% 67% 17% 10% Inventory % of Next Year COGS Accounts Payable % of Next Year COGS Initial NWC (in thousands) Sales Growth After Year 6 Free Cash Flow Growth After Year 6 Initial Capital Expenditure (in thousands) 20% 15% $6,000 2% 2% $9,000 25% 10% $4,500 0% 0% $7,000 15% 20% $7,500 4% 4% $11,000 For example, vary the parameter Sales in Year 1" from the worst case ($27 million) to the best case ($33 million), holding all the other parameters fixed (at the level of initial assumptions). Then fill in the highlighted blank boxes for NPV in the sheet of Sensitivity Analysis". Copy your baseline projections to this sheet and do the sensitivity analysis in this sheet, so that your sensitivity analysis won't alter your baseline result in the NPV sheet. Sensitivity Analysis Parameter Initial Assumption Worst Case Best Case NPV NPV NPV NPV
Step by Step Solution
There are 3 Steps involved in it

Get step-by-step solutions from verified subject matter experts