

Question: 6. The toy car moves according to the data below. Graph the position-time graph and the velocity-time graph using the data in the table.
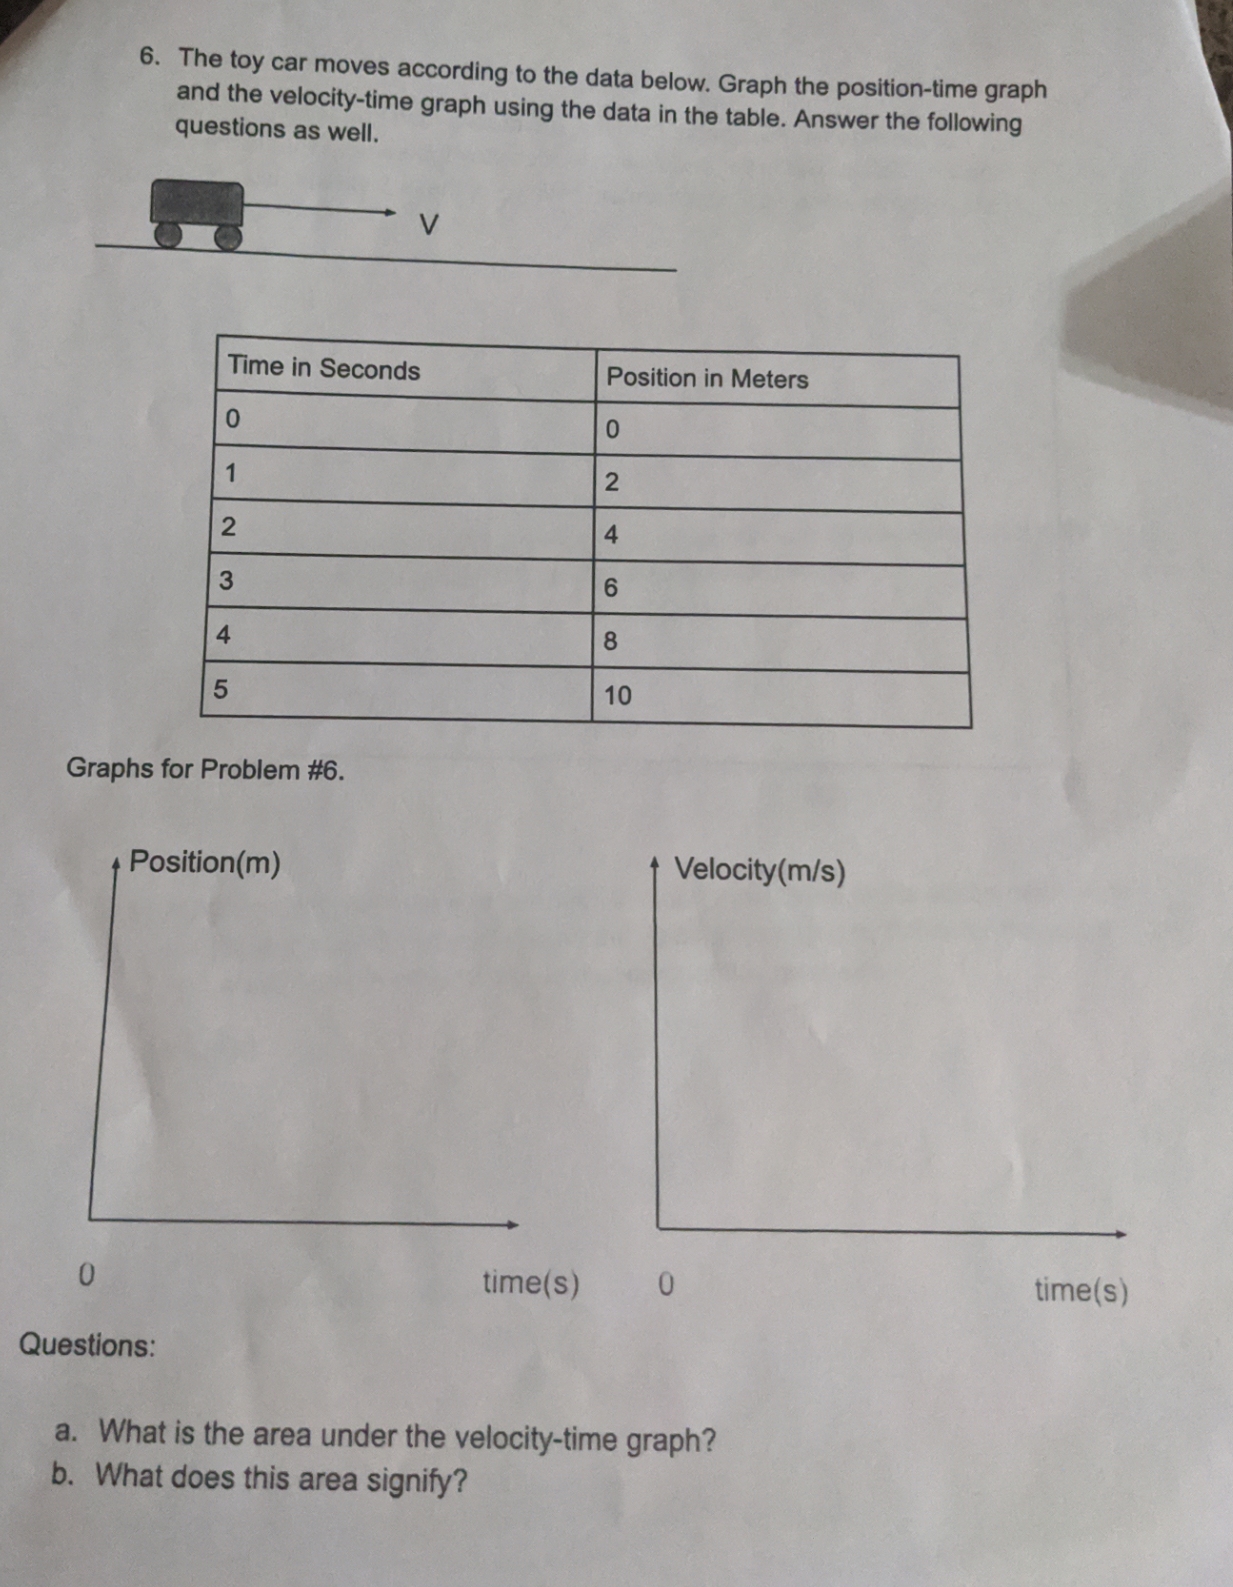
6. The toy car moves according to the data below. Graph the position-time graph and the velocity-time graph using the data in the table. Answer the following questions as well. Time in Seconds 0 Position in Meters 0 1 2 2 4 3 6 4 8 5 10 Graphs for Problem #6. Position(m) Velocity(m/s) 0 Questions: time(s) 0 time(s) a. What is the area under the velocity-time graph? b. What does this area signify?
Step by Step Solution
There are 3 Steps involved in it
1 Expert Approved Answer
Step: 1 Unlock

Question Has Been Solved by an Expert!
Get step-by-step solutions from verified subject matter experts
Step: 2 Unlock
Step: 3 Unlock